

Nov 29, 2025
IndexBox has just published a new report: Australia – Gym and Fitness Equipment – Market Analysis, Forecast, Size, Trends and Insights.
This market analysis provides a comprehensive overview of the gym and fitness equipment sector in Australia. After a period of decline, the market showed signs of recovery in 2024, with consumption reaching 33K tons and market value soaring to $260M. The market is forecast for steady growth, with a projected volume CAGR of +2.9% and a value CAGR of +3.8% from 2024 to 2035, reaching 46K tons and $391M by 2035. Australia is heavily reliant on imports, primarily from China, which constituted 60% of import volume and 64% of import value in 2024. Import prices have seen a remarkable increase, averaging $9,911 per ton. Conversely, exports have declined significantly, with New Zealand being the primary destination, accounting for 35% of export value.
Key Findings
Market forecast to grow to 46K tons and $391M by 2035 with CAGRs of +2.9% and +3.8% respectivelyMarket recovery in 2024 with consumption at 33K tons and market value at $260M after a two-year declineChina is the dominant import source, supplying 60% of volume and 64% of valueImport prices have risen sharply, averaging $9,911 per ton in 2024Exports fell significantly to 903 tons, with New Zealand as the primary destinationMarket Forecast
Driven by rising demand for gym and fitness equipment in Australia, the market is expected to start an upward consumption trend over the next decade. The performance of the market is forecast to increase slightly, with an anticipated CAGR of +2.9% for the period from 2024 to 2035, which is projected to bring the market volume to 46K tons by the end of 2035.
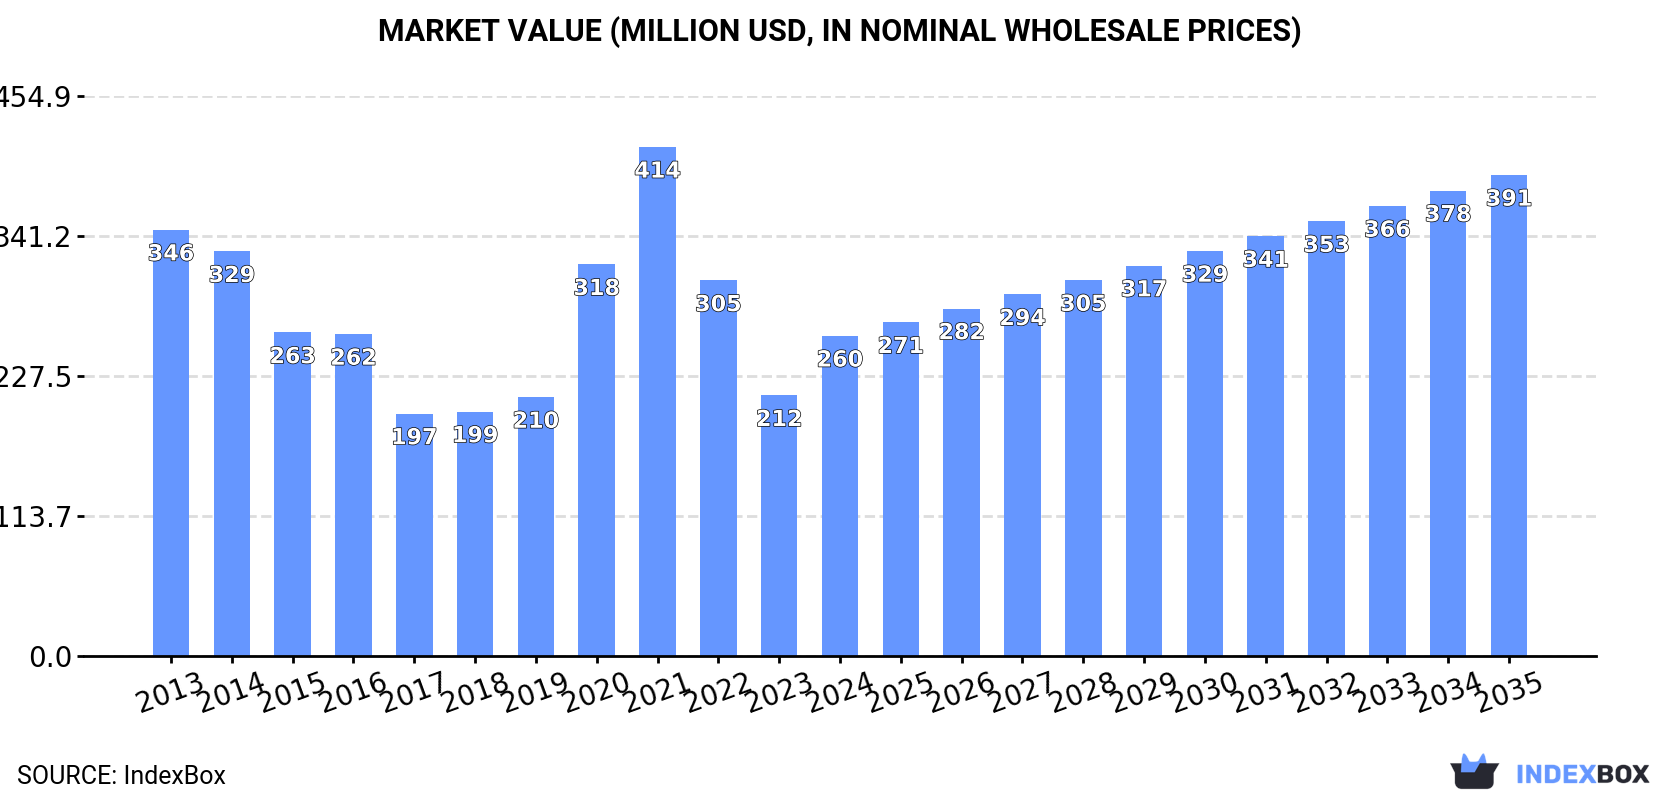
In value terms, the market is forecast to increase with an anticipated CAGR of +3.8% for the period from 2024 to 2035, which is projected to bring the market value to $391M (in nominal wholesale prices) by the end of 2035.
 ConsumptionAustralia’s Consumption of Gym and Fitness Equipment
In 2024, consumption of gym and fitness equipment was finally on the rise to reach 33K tons for the first time since 2021, thus ending a two-year declining trend. Over the period under review, consumption, however, showed a abrupt contraction. Over the period under review, consumption reached the maximum volume at 76K tons in 2013; however, from 2014 to 2024, consumption stood at a somewhat lower figure.
The size of the gym and fitness equipment market in Australia soared to $260M in 2024, surging by 23% against the previous year. This figure reflects the total revenues of producers and importers (excluding logistics costs, retail marketing costs, and retailers’ margins, which will be included in the final consumer price). In general, consumption, however, continues to indicate a noticeable downturn. Over the period under review, the market reached the peak level at $414M in 2021; however, from 2022 to 2024, consumption stood at a somewhat lower figure.
ImportsAustralia’s Imports of Gym and Fitness Equipment
After two years of decline, overseas purchases of gym and fitness equipment increased by 15% to 34K tons in 2024. Over the period under review, imports, however, recorded a abrupt descent. The pace of growth appeared the most rapid in 2020 when imports increased by 46% against the previous year. Imports peaked at 77K tons in 2013; however, from 2014 to 2024, imports remained at a lower figure.
In value terms, gym and fitness equipment imports soared to $339M in 2024. In general, imports continue to indicate a temperate expansion. The most prominent rate of growth was recorded in 2020 with an increase of 52% against the previous year. Imports peaked at $499M in 2021; however, from 2022 to 2024, imports failed to regain momentum.
Imports By Country
In 2024, China (20K tons) constituted the largest gym and fitness equipment supplier to Australia, accounting for a 60% share of total imports. Moreover, gym and fitness equipment imports from China exceeded the figures recorded by the second-largest supplier, the United States (4K tons), fivefold. Taiwan (Chinese) (2.5K tons) ranked third in terms of total imports with a 7.2% share.
From 2013 to 2024, the average annual growth rate of volume from China stood at -9.9%. The remaining supplying countries recorded the following average annual rates of imports growth: the United States (-0.7% per year) and Taiwan (Chinese) (-6.2% per year).
In value terms, China ($216M) constituted the largest supplier of gym and fitness equipment to Australia, comprising 64% of total imports. The second position in the ranking was held by the United States ($34M), with a 9.9% share of total imports. It was followed by Taiwan (Chinese), with a 6.9% share.
From 2013 to 2024, the average annual rate of growth in terms of value from China amounted to +2.8%. The remaining supplying countries recorded the following average annual rates of imports growth: the United States (-2.4% per year) and Taiwan (Chinese) (-1.8% per year).
Import Prices By Country
The average gym and fitness equipment import price stood at $9,911 per ton in 2024, rising by 7.2% against the previous year. In general, the import price enjoyed a remarkable increase. The most prominent rate of growth was recorded in 2017 an increase of 110%. Over the period under review, average import prices hit record highs in 2024 and is likely to see steady growth in years to come.
Average prices varied somewhat amongst the major supplying countries. In 2024, amid the top importers, the countries with the highest prices were China ($10,611 per ton) and Taiwan (Chinese) ($9,569 per ton), while the price for Italy ($8,199 per ton) and Germany ($8,223 per ton) were amongst the lowest.
From 2013 to 2024, the most notable rate of growth in terms of prices was attained by China (+14.1%), while the prices for the other major suppliers experienced more modest paces of growth.
ExportsAustralia’s Exports of Gym and Fitness Equipment
For the third year in a row, Australia recorded decline in shipments abroad of gym and fitness equipment, which decreased by -39.6% to 903 tons in 2024. Over the period under review, exports, however, saw a relatively flat trend pattern. The growth pace was the most rapid in 2021 with an increase of 105%. As a result, the exports reached the peak of 2K tons. From 2022 to 2024, the growth of the exports failed to regain momentum.
In value terms, gym and fitness equipment exports fell markedly to $10M in 2024. Overall, total exports indicated a modest expansion from 2013 to 2024: its value increased at an average annual rate of +1.4% over the last eleven years. The trend pattern, however, indicated some noticeable fluctuations being recorded throughout the analyzed period. Based on 2024 figures, exports decreased by -34.1% against 2022 indices. The most prominent rate of growth was recorded in 2021 when exports increased by 59% against the previous year. Over the period under review, the exports attained the peak figure at $16M in 2022; however, from 2023 to 2024, the exports stood at a somewhat lower figure.
Exports By Country
New Zealand (316 tons) was the main destination for gym and fitness equipment exports from Australia, with a 35% share of total exports. Moreover, gym and fitness equipment exports to New Zealand exceeded the volume sent to the second major destination, the United States (60 tons), fivefold. The third position in this ranking was taken by Papua New Guinea (52 tons), with a 5.7% share.
From 2013 to 2024, the average annual growth rate of volume to New Zealand totaled -1.9%. Exports to the other major destinations recorded the following average annual rates of exports growth: the United States (-0.9% per year) and Papua New Guinea (-6.0% per year).
In value terms, New Zealand ($3.6M) remains the key foreign market for gym and fitness equipment exports from Australia, comprising 35% of total exports. The second position in the ranking was held by the United States ($692K), with a 6.7% share of total exports. It was followed by Papua New Guinea, with a 5.7% share.
From 2013 to 2024, the average annual growth rate of value to New Zealand was relatively modest. Exports to the other major destinations recorded the following average annual rates of exports growth: the United States (-0.3% per year) and Papua New Guinea (-2.3% per year).
Export Prices By Country
The average gym and fitness equipment export price stood at $11,439 per ton in 2024, picking up by 23% against the previous year. Overall, the export price continues to indicate a relatively flat trend pattern. The most prominent rate of growth was recorded in 2017 an increase of 61%. The export price peaked at $12,177 per ton in 2018; however, from 2019 to 2024, the export prices remained at a lower figure.
Average prices varied noticeably for the major overseas markets. In 2024, amid the top suppliers, the countries with the highest prices were the United Arab Emirates ($11,439 per ton) and French Polynesia ($11,439 per ton), while the average price for exports to Singapore ($11,439 per ton) and the UK ($11,439 per ton) were amongst the lowest.
From 2013 to 2024, the most notable rate of growth in terms of prices was recorded for supplies to the Netherlands (+4.3%), while the prices for the other major destinations experienced more modest paces of growth.


