

Dec 2, 2025
IndexBox has just published a new report: Latin America and the Caribbean – Provitamins And Vitamins – Market Analysis, Forecast, Size, Trends and Insights.
The article provides a comprehensive analysis of the provitamins and vitamins market in Latin America and the Caribbean. It details that in 2024, consumption reached 97K tons, valued at $1.2B, with Brazil, Chile, and Mexico as the top consumers. Production was significantly lower at 25K tons, concentrated in Chile, Peru, and Uruguay, leading to substantial imports of 76K tons, primarily by Brazil. The market is forecast to grow to 117K tons (CAGR +1.7%) and $1.7B (CAGR +3.1%) by 2035. Key trade flows, product types (notably Vitamin C, E, and others), and price trends are also examined, highlighting Guatemala’s rapid growth and Chile’s high per capita consumption.
Key Findings
Market forecast to reach 117K tons and $1.7B by 2035, growing at CAGRs of +1.7% and +3.1%, respectivelyBrazil, Chile, and Mexico dominate consumption, accounting for 65% of volume and value in 2024Regional production (25K tons) meets only ~26% of demand, driving high import reliance, led by BrazilGuatemala shows the fastest consumption and import growth rates among major countriesVitamin C and E derivatives are the most traded products by volume, while Vitamin B12 commands the highest priceMarket Forecast
Driven by increasing demand for provitamins and vitamins in Latin America and the Caribbean, the market is expected to continue an upward consumption trend over the next decade. Market performance is forecast to decelerate, expanding with an anticipated CAGR of +1.7% for the period from 2024 to 2035, which is projected to bring the market volume to 117K tons by the end of 2035.
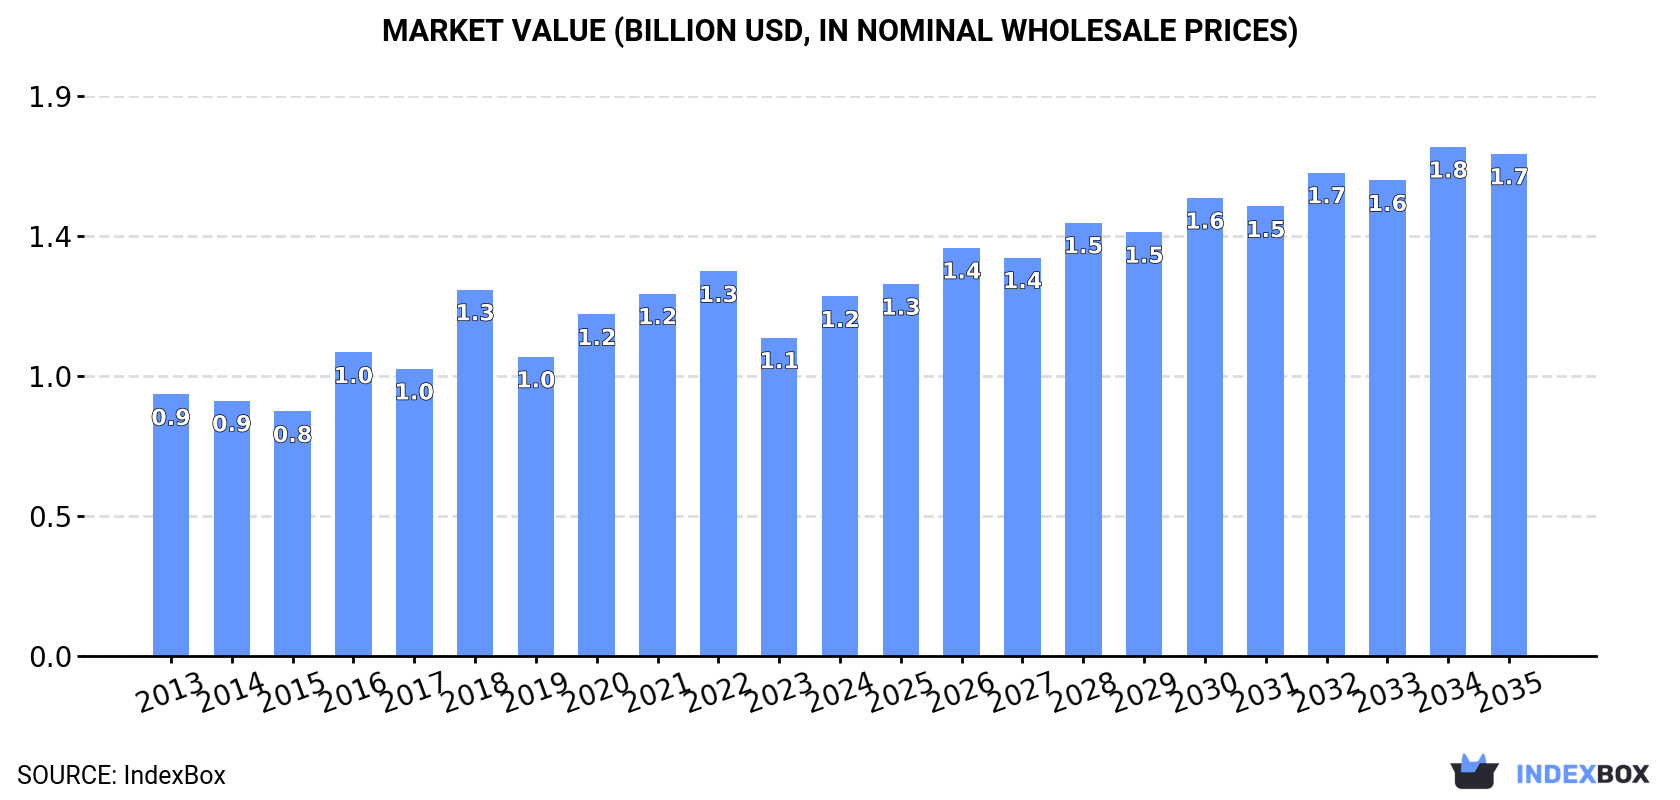
In value terms, the market is forecast to increase with an anticipated CAGR of +3.1% for the period from 2024 to 2035, which is projected to bring the market value to $1.7B (in nominal wholesale prices) by the end of 2035.
 ConsumptionLatin America and the Caribbean’s Consumption of Provitamins And Vitamins
In 2024, approx. 97K tons of provitamins and vitamins were consumed in Latin America and the Caribbean; with an increase of 14% on 2023. The total consumption volume increased at an average annual rate of +3.0% over the period from 2013 to 2024; however, the trend pattern indicated some noticeable fluctuations being recorded in certain years. As a result, consumption attained the peak volume and is likely to continue growth in the immediate term.
The revenue of the vitamin market in Latin America and the Caribbean rose significantly to $1.2B in 2024, picking up by 13% against the previous year. This figure reflects the total revenues of producers and importers (excluding logistics costs, retail marketing costs, and retailers’ margins, which will be included in the final consumer price). The market value increased at an average annual rate of +2.9% from 2013 to 2024; however, the trend pattern indicated some noticeable fluctuations being recorded throughout the analyzed period. Over the period under review, the market attained the maximum level at $1.3B in 2022; however, from 2023 to 2024, consumption failed to regain momentum.
Consumption By Country
The countries with the highest volumes of consumption in 2024 were Brazil (31K tons), Chile (19K tons) and Mexico (13K tons), with a combined 65% share of total consumption. Peru, Guatemala, Argentina and Colombia lagged somewhat behind, together accounting for a further 24%.
From 2013 to 2024, the most notable rate of growth in terms of consumption, amongst the main consuming countries, was attained by Guatemala (with a CAGR of +10.4%), while consumption for the other leaders experienced more modest paces of growth.
In value terms, Brazil ($392M), Chile ($243M) and Mexico ($170M) constituted the countries with the highest levels of market value in 2024, with a combined 65% share of the total market. Peru, Guatemala, Colombia and Argentina lagged somewhat behind, together accounting for a further 24%.
Guatemala, with a CAGR of +10.3%, saw the highest growth rate of market size in terms of the main consuming countries over the period under review, while market for the other leaders experienced more modest paces of growth.
In 2024, the highest levels of vitamin per capita consumption was registered in Chile (995 kg per 1000 persons), followed by Guatemala (309 kg per 1000 persons), Peru (299 kg per 1000 persons) and Brazil (142 kg per 1000 persons), while the world average per capita consumption of vitamin was estimated at 144 kg per 1000 persons.
In Chile, vitamin per capita consumption remained relatively stable over the period from 2013-2024. The remaining consuming countries recorded the following average annual rates of per capita consumption growth: Guatemala (+8.6% per year) and Peru (+1.7% per year).
ProductionLatin America and the Caribbean’s Production of Provitamins And Vitamins
In 2024, the amount of provitamins and vitamins produced in Latin America and the Caribbean totaled 25K tons, remaining constant against the previous year. In general, production showed a relatively flat trend pattern. The pace of growth was the most pronounced in 2015 with an increase of 7.6%. The volume of production peaked in 2024 and is likely to see gradual growth in years to come.
In value terms, vitamin production fell to $322M in 2024 estimated in export price. Overall, production, however, saw a mild setback. The pace of growth was the most pronounced in 2017 when the production volume increased by 55%. The level of production peaked at $748M in 2022; however, from 2023 to 2024, production failed to regain momentum.
Production By Country
The countries with the highest volumes of production in 2024 were Chile (14K tons), Peru (7.5K tons) and Uruguay (2.1K tons), together accounting for 92% of total production.
From 2013 to 2024, the biggest increases were recorded for Peru (with a CAGR of +2.1%), while production for the other leaders experienced mixed trends in the production figures.
ImportsLatin America and the Caribbean’s Imports of Provitamins And Vitamins
Vitamin imports surged to 76K tons in 2024, increasing by 16% against the previous year’s figure. Total imports indicated a temperate increase from 2013 to 2024: its volume increased at an average annual rate of +4.0% over the last eleven years. The trend pattern, however, indicated some noticeable fluctuations being recorded throughout the analyzed period. The pace of growth appeared the most rapid in 2020 when imports increased by 16%. The volume of import peaked in 2024 and is expected to retain growth in the near future.
In value terms, vitamin imports stood at $742M in 2024. Total imports indicated notable growth from 2013 to 2024: its value increased at an average annual rate of +2.0% over the last eleven-year period. The trend pattern, however, indicated some noticeable fluctuations being recorded throughout the analyzed period. Based on 2024 figures, imports decreased by -15.8% against 2022 indices. The most prominent rate of growth was recorded in 2018 when imports increased by 50% against the previous year. As a result, imports attained the peak of $987M. From 2019 to 2024, the growth of imports remained at a lower figure.
Imports By Country
Brazil was the main importer of provitamins and vitamins in Latin America and the Caribbean, with the volume of imports resulting at 30K tons, which was approx. 39% of total imports in 2024. Mexico (13K tons) ranks second in terms of the total imports with an 18% share, followed by Guatemala (8.1%), Chile (7.9%), Colombia (5.8%) and Argentina (5%). Peru (2.9K tons) followed a long way behind the leaders.
From 2013 to 2024, average annual rates of growth with regard to vitamin imports into Brazil stood at +6.3%. At the same time, Guatemala (+9.4%), Chile (+6.9%), Peru (+5.7%), Mexico (+4.3%) and Colombia (+3.7%) displayed positive paces of growth. Moreover, Guatemala emerged as the fastest-growing importer imported in Latin America and the Caribbean, with a CAGR of +9.4% from 2013-2024. Argentina experienced a relatively flat trend pattern. From 2013 to 2024, the share of Brazil, Guatemala and Chile increased by +8.3, +3.4 and +2 percentage points, respectively. The shares of the other countries remained relatively stable throughout the analyzed period.
In value terms, Brazil ($284M) constitutes the largest market for imported provitamins and vitamins in Latin America and the Caribbean, comprising 38% of total imports. The second position in the ranking was held by Mexico ($120M), with a 16% share of total imports. It was followed by Colombia, with a 7% share.
In Brazil, vitamin imports increased at an average annual rate of +5.2% over the period from 2013-2024. The remaining importing countries recorded the following average annual rates of imports growth: Mexico (+0.4% per year) and Colombia (+2.0% per year).
Imports By Type
Vitamins; vitamin c and its derivatives, unmixed (28K tons) and vitamins; vitamin e and its derivatives, unmixed (24K tons) were the key types of provitamins and vitamins in 2024, recording approx. 37% and 31% of total imports, respectively. Vitamins; n.e.s. in item no. 2936.2, and their derivatives, unmixed (11K tons) took the next position in the ranking, distantly followed by vitamins; d- or DL-pantothenic acid (vitamin B3 or vitamin B5) and its derivatives, unmixed (3.7K tons). All these products together held approx. 19% share of total imports. Vitamins; n.e.s. in heading no. 2936, including natural concentrates (3.2K tons), vitamins; vitamins a and their derivatives, unmixed (2.2K tons), vitamins; vitamin B2 and its derivatives, unmixed (1.3K tons) and vitamins; vitamin B6 and its derivatives, unmixed (1.3K tons) followed a long way behind the leaders.
From 2013 to 2024, the most notable rate of growth in terms of purchases, amongst the main imported products, was attained by vitamins; vitamin e and its derivatives, unmixed (with a CAGR of +7.0%), while imports for the other products experienced more modest paces of growth.
In value terms, the largest types of imported provitamins and vitamins were vitamins; vitamin e and its derivatives, unmixed ($224M), vitamins; n.e.s. in item no. 2936.2, and their derivatives, unmixed ($165M) and vitamins; vitamin c and its derivatives, unmixed ($101M), together comprising 66% of total imports.
Vitamins; vitamin e and its derivatives, unmixed, with a CAGR of +3.9%, recorded the highest rates of growth with regard to the value of imports, in terms of the main imported products over the period under review, while purchases for the other products experienced more modest paces of growth.
Import Prices By Type
The import price in Latin America and the Caribbean stood at $9,792 per ton in 2024, dropping by -6.3% against the previous year. Over the period under review, the import price showed a slight decrease. The pace of growth appeared the most rapid in 2018 when the import price increased by 33% against the previous year. As a result, import price reached the peak level of $16,819 per ton. From 2019 to 2024, the import prices failed to regain momentum.
Prices varied noticeably by the product type; the product with the highest price was vitamins; vitamin B12 and its derivatives, unmixed ($115,549 per ton), while the price for vitamins; vitamin c and its derivatives, unmixed ($3,645 per ton) was amongst the lowest.
From 2013 to 2024, the most notable rate of growth in terms of prices was attained by vitamins; vitamins a and their derivatives, unmixed (+2.7%), while the other products experienced more modest paces of growth.
Import Prices By Country
The import price in Latin America and the Caribbean stood at $9,792 per ton in 2024, waning by -6.3% against the previous year. In general, the import price continues to indicate a mild descent. The most prominent rate of growth was recorded in 2018 an increase of 33% against the previous year. As a result, import price reached the peak level of $16,819 per ton. From 2019 to 2024, the import prices remained at a somewhat lower figure.
There were significant differences in the average prices amongst the major importing countries. In 2024, amid the top importers, the country with the highest price was Peru ($13,197 per ton), while Chile ($6,942 per ton) was amongst the lowest.
From 2013 to 2024, the most notable rate of growth in terms of prices was attained by Argentina (+0.7%), while the other leaders experienced a decline in the import price figures.
ExportsLatin America and the Caribbean’s Exports of Provitamins And Vitamins
Vitamin exports dropped markedly to 3.5K tons in 2024, reducing by -31.6% compared with the year before. In general, exports, however, saw a relatively flat trend pattern. The most prominent rate of growth was recorded in 2017 with an increase of 32%. The volume of export peaked at 5.1K tons in 2021; however, from 2022 to 2024, the exports failed to regain momentum.
In value terms, vitamin exports contracted dramatically to $39M in 2024. Over the period under review, exports showed a deep contraction. The pace of growth appeared the most rapid in 2017 with an increase of 22% against the previous year. Over the period under review, the exports attained the maximum at $70M in 2013; however, from 2014 to 2024, the exports failed to regain momentum.
Exports By Country
The biggest shipments were from Colombia (679 tons), Brazil (671 tons), Guatemala (527 tons), Chile (465 tons) and Ecuador (374 tons), together reaching 79% of total export. It was distantly followed by Uruguay (219 tons), achieving a 6.4% share of total exports. Peru (119 tons) held a little share of total exports.
From 2013 to 2024, the most notable rate of growth in terms of shipments, amongst the key exporting countries, was attained by Chile (with a CAGR of +43.3%), while the other leaders experienced more modest paces of growth.
In value terms, the largest vitamin supplying countries in Latin America and the Caribbean were Colombia ($7.6M), Brazil ($5.3M) and Guatemala ($4.9M), with a combined 46% share of total exports. Chile, Uruguay, Ecuador and Peru lagged somewhat behind, together comprising a further 27%.
Among the main exporting countries, Chile, with a CAGR of +34.9%, saw the highest growth rate of the value of exports, over the period under review, while shipments for the other leaders experienced more modest paces of growth.
Exports By Type
Vitamins; n.e.s. in heading no. 2936, including natural concentrates (1,038 tons), vitamins; vitamin c and its derivatives, unmixed (735 tons) and vitamins; vitamin e and its derivatives, unmixed (684 tons) represented roughly 71% of total exports in 2024. Vitamins; n.e.s. in item no. 2936.2, and their derivatives, unmixed (411 tons) ranks next in terms of the total exports with a 12% share, followed by vitamins; vitamins a and their derivatives, unmixed (11%). Vitamins; d- or DL-pantothenic acid (vitamin B3 or vitamin B5) and its derivatives, unmixed (56 tons) followed a long way behind the leaders.
From 2013 to 2024, the most notable rate of growth in terms of shipments, amongst the main exported products, was attained by vitamins; vitamin c and its derivatives, unmixed (with a CAGR of +6.3%), while the other products experienced more modest paces of growth.
In value terms, the largest types of exported provitamins and vitamins were vitamins; n.e.s. in heading no. 2936, including natural concentrates ($12M), vitamins; vitamin c and its derivatives, unmixed ($6.3M) and vitamins; n.e.s. in item no. 2936.2, and their derivatives, unmixed ($5.3M), with a combined 61% share of total exports.
Vitamins; vitamin c and its derivatives, unmixed, with a CAGR of +6.4%, saw the highest growth rate of the value of exports, in terms of the main exported products over the period under review, while shipments for the other products experienced more modest paces of growth.
Export Prices By Type
The export price in Latin America and the Caribbean stood at $11,241 per ton in 2024, with an increase of 4.8% against the previous year. In general, the export price, however, recorded a deep reduction. The pace of growth appeared the most rapid in 2022 an increase of 24%. The level of export peaked at $20,917 per ton in 2013; however, from 2014 to 2024, the export prices remained at a lower figure.
There were significant differences in the average prices amongst the major exported products. In 2024, the product with the highest price was vitamins; vitamin B12 and its derivatives, unmixed ($220,947 per ton), while the average price for exports of vitamins; vitamins a and their derivatives, unmixed ($5,830 per ton) was amongst the lowest.
From 2013 to 2024, the most notable rate of growth in terms of prices was attained by vitamins; vitamin B2 and its derivatives, unmixed (+2.0%), while the other products experienced more modest paces of growth.
Export Prices By Country
In 2024, the export price in Latin America and the Caribbean amounted to $11,241 per ton, surging by 4.8% against the previous year. In general, the export price, however, recorded a abrupt setback. The most prominent rate of growth was recorded in 2022 an increase of 24%. Over the period under review, the export prices hit record highs at $20,917 per ton in 2013; however, from 2014 to 2024, the export prices stood at a somewhat lower figure.
There were significant differences in the average prices amongst the major exporting countries. In 2024, amid the top suppliers, the country with the highest price was Peru ($14,123 per ton), while Ecuador ($5,593 per ton) was amongst the lowest.
From 2013 to 2024, the most notable rate of growth in terms of prices was attained by Uruguay (+0.3%), while the other leaders experienced a decline in the export price figures.


