

Overall, 648 papers were identified through database searches, and an additional 22 were retrieved via other methods, including web-based searches, and references from relevant papers. Figure 1 shows a flowchart of the selection process for the review, providing a detailed summary of the search results. After duplications were removed, the title and abstracts of 105 records were screened. Out of the 105 papers, 51 papers were excluded after the title and abstract screening because they did not meet the selection criteria. Throughout the full-text screening, 37 papers were excluded because the screening outcome did not fit with the aims of this study. The criteria-based exclusion process included the following main aspects: the record was a review paper, the full-text version was inaccessible, non-English language, and no information on nutritional intake, food consumption or eating habits. Finally, 13 studies were eligible and reviewed in this study.
Fig. 1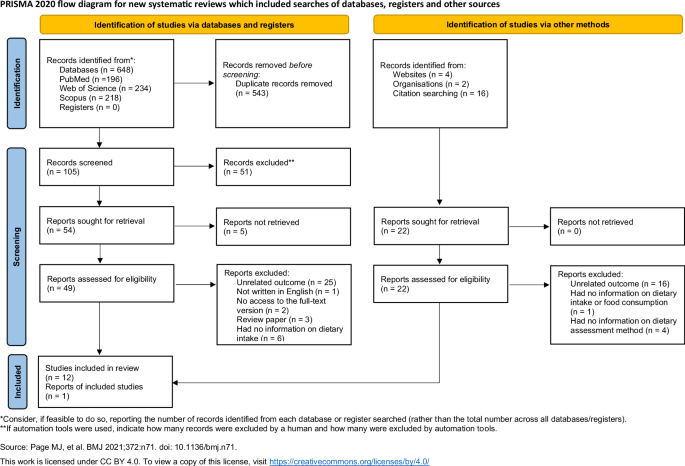
PRISMA flow diagram of the literature search process.
The characteristics of the reviewed studies
Most of the studies were conducted in Central and Southeastern-European countries, out of 13 studies 1 was carried out in Spain [24], 3 in Hungary [25, 26, 27], 3 in Slovakia [28, 29, 30], 4 in the Czech Republic [31, 32,33,34], 1 in Albania [35], and 1 in Romania [36]. As for the study design, the majority of the selected studies were cross-sectional, [25, 26, 28, 29, 31, 35, 27, 32,33,34] out of which 10 applied a quantitative approach, and one mixed methodology [32]. Three studies conducted a retrospective study design using existing data [24, 30, 36]. The sample sizes ranged from 150 to 797 participants in the quantitative surveys, with the exception of the two studies conducting national surveys. The number of participants was between 25 and 70 in those studies that applied either mixed or qualitative methodologies. Among the studies, only the ones conducted in Hungary (n = 3) [25, 26, 27] mentioned whether the sample included in the study can be considered representative. They reported that the examined Roma population can be considered representative only for the Hungarian Roma living in segregated colonies in the given region but it is not representative of the entire Roma population living in Hungary [25, 26, 27].
Among the reviewed studies, there was one Romanian study in which the diet of the Roma population at the household level was examined: for data analysis of the Household Budget Survey (HBS) (n = 2654) was acquired [36]. Four studies were conducted by only including Roma participants [29, 30, 32, 35], while in 9 studies there also was a control group recruited [24,25,26,28, 27, 31, 33, 34, 36]. They were made up of participants selected from other ethnic groups or the non-Roma population from the majority of society living in the same country.
Most studies have utilized non-probability sampling methods such as stratified two-stage cluster sampling [25, 26], random sampling [27, 33, 34], or convenience sampling [31], while in one reviewed article, the sampling method was not mentioned at all [36]. As for the place of studies, 2 studies were conducted in an urban setting [29, 35] while others had recruited participants from segregated colonies/settlements [25, 26, 28, 30] or different regions (e.g. South-Bohemian Region [32,33,34]. In two studies, the dietary intake and food consumption of the Roma population were examined at the national level [24, 36]. Several studies used validated dietary data recording tools [25, 26, 27, 29, 33, 34], while some did not mention whether the tools were validated or not [24, 28, 31, 35, 36, 30, 32]. As for dietary reference to compare the Roma minority’s diets with, some studies generated dietary patterns of the non-Roma population (i.e., majority population) for reference [24, 28, 31, 35, 36], some compared nutrient intakes against Recommended Dietary Intake Values, others assessed adherence to Food-Based Dietary Guidelines, or both [25, 26, 33], while the two studies using qualitative approach did not mention dietary references to compare Roma minority’s diets with [30, 32]. Specific characteristics of the reviewed articles are presented in Table 2.
Table 2 Summary of general characteristics of the included articles on nutrition in the Roma population.Dietary assessment methods
Dietary data collection and assessment methods as well as the results of the selected studies were reviewed – for pragmatic reasons – according to the methodological approach classified as follows:
(1)
Quantitative approaches
a.
24 h dietary recall surveys
b.
Tools for assessing dietary quality
(2)
Qualitative (portions not included) or Quantitative (portions included) Food Frequency Questionnaires
(3)
Qualitative approaches
a.
interviews
b.
document analysis
In several studies, 24-h dietary recall and FFQ were both used, so these studies are mentioned in the supporting information tables multiple times in the detailed analysis of the respective methodology.
Dietary assessment and results based on data from 24-h dietary recall
Three of the four studies that used the dietary recall reported using a single recall for the indicated reference time [29, 33, 34] while one study chose multiple recalls [26]. The studies that used multiple recalls, reported that the number of recorded days were not consecutive. One of the studies described using either food images or kitchen utensils for the description of portion sizes [26] while three studies did not mention how portion sizes were measured. Two studies identified the food composition table/database they used in their studies [26, 29]. One of them described the use of a food composition database while in other studies, the authors did not describe which database was used. Three of four studies that used a 24-h dietary recall reported that the tool was validated [26, 33, 34], and one study did not describe the validation process [29]. National or self-developed nutrition software was used to analyze the dietary data in three studies [26, 29, 33], one study did not describe the analysis tool they used [34]. Two studies reported that dietary assessments were conducted by a trained interviewer [26, 34]. Only one study focused on the adaptation of study instruments to the targeted Roma population by identifying commonly consumed ethnic foods and dishes widely used kitchen utensils or expanding food composition tables with traditional foods [26]. The main form of administration was face-to-face interviews, which were conducted with the help of trained interviewers. The outcome of the studies using 24-h dietary recall was the nutritional intake of the Roma respondents in terms of daily energy, macro-, and micronutrient intake amounts.
The results of Llanaj et al. [26] showed that the mean daily intake of fat and protein was higher than the recommended dietary allowance originating in a high proportion of animal-based protein and cholesterol intake. Total carbohydrate daily intake was lower than the recommended according to internationally accepted guidelines, however, significantly higher sugar intake was reported [26]. Dietary intakes of micro-nutrients and dietary fiber did not meet reference values [26, 29]. Specific details from studies that used 24-h dietary recall have been summarized in Supplementary Table S3 in the Supporting Information online.
Dietary quality assessment and results based on calculated dietary quality scores
In addition to the assessment of nutritional intake and food consumption of the Roma population, 4 studies examined dietary quality with dietary quality scores as tools [24, 25, 27, 36]. Ciaian et al. [36] used an econometric approach in their study; diet diversity was measured by the number of food items consumed. The Simpson index, and by Entropy index and the data required for the analysis was acquired from Household Budget Survey data. This was the only research that examined food consumption at the household level. In the other three studies, individual-level nutrient-based dietary patterns or food intake data formed the basis of the analysis [24, 25, 27]. Complex indices were applied to assess dietary quality: Healthy Eating Index-2015 (HEI-2015), Healthy Diet Indicator, Dietary Inflammatory Index, Dietary Approaches to Stop Hypertension, EAT-Lancet [24, 25, 36]. Detailed information on studies that assessed dietary quality has been provided in Supplementary Table S4 in the Supporting Information online.
In these studies, the results on the following dietary quality scores were analyzed and compared: diet diversity gap between Roma and non-Roma respondents, adherence to healthy eating, or alignment to food-based dietary guidelines [24, 25, 27, 36]. The results of the study of Ciaian et al. [36] showed that there is a significant gap in diet diversity between Roma and non-Roma groups. Furthermore, the Roma population’s dietary quality was significantly lower according to HEI and econometric indexes too [27]. The Roma ethnicity had no significant effect on healthy nutrient-based patterns while poor adherence to selected dietary guidelines (DII, HDI, DASH, EAT-Lancet) has been shown in both populations, however, Roma ethnicity was associated with lower DII [25]. According to the results of Porras et al. [24] the Roma population have a lower adherence to the Spanish dietary guidelines compared to the non-Roma population. Their analysis showed that age is the most influential variable in food consumption, and this tendency is even more pronounced within the Romani population.
Dietary assessment and results based on data from food frequency questionnaire
From the set of the reviewed articles, 7 studies used FFQ [28, 29, 31, 35, 32,33,34] for recording dietary data, out of which 5 carried out the survey in the frame of face-to-face interviews, while in only 2 studies it was mentioned that the data was collected with the help of a trained interviewer. None of the studies had information on the inclusion of ethnic foods in the FFQ, the source of the FFQ, and whether the FFQ was adapted to the Roma population. Three studies have reported the reference time of the FFQ [28, 31, 32] while another study has reported that they have used a FFQ specifically developed for the survey [31]. There were only two studies that have described the number of foods/food groups included in the FFQ [28, 32] and one study has reported the most frequently consumed foods provided by FFQ [35].
One study has applied a more complex statistical method (i.e. factor analysis) to evaluate the dietary data by which they could describe the dietary pattern of the Roma population [35].
These studies revealed the eating habits of the Roma population including food and drink consumption, frequency of meals, and evaluation of balanced healthy eating [28, 29, 31, 35, 32,33,34]. In terms of food consumption, the consumption of fruits, vegetables, and dairy products was significantly lower and the consumption of high-sugar drinks and side dishes such as potatoes, pasta, rice, and dumplings was higher in the Roma population compared to non-Roma respondents [28, 32, 33, 35]. According to the results of Dolák et al. [34] the eating habits of the focused Roma population were characterized by irregularities compared to the majority Czech population. Specific details from studies that used FFQ can be found in Supplementary Table S5 in the Supporting Information online.
Dietary assessment and results based on qualitative methods
The dietary habits of the Roma population were investigated through semi-structured and in-depth interviews, as well as document analysis in two studies [30, 32]. Both studies used open-ended questions in face-to-face interviews to collect data. The questions were tailored to the purpose of the studies, but the source of the questions was not mentioned. One of these studies was based on an ethnographic field research [30]; the authors used classical sociological theory to interpret the obtained data. The other study applied the grounded theory methodology and they used MAXQDA software to analyse the textual data [32].
In both researches, main and subcategories were created to classify the diet of the focused Roma population and the following themes and topics were identified from the analyses: food storage, traditional Roma foods, motivation for foodstuff selection, preferred preparation of foodstuff, place of eating, regularity of eating, and food as a measure of wealth [30, 32]. According to the results of this research, the nutritional culture of the Roma is characterized by irregular eating and moderate overconsumption and eating as a symbol of social status in the Roma community [32]. In addition, the findings revealed that the food and eating habits of the Roma have not significantly changed over the centuries, the nutrition of the Roma population was similar to the nutrition of the low-income non-Roma population (Supplementary Table S6 in the Supporting Information online) [30].


