

Feb 1, 2026
IndexBox has just published a new report: Africa – Medicaments Containing Vitamins And Provitamins – Market Analysis, Forecast, Size, Trends And Insights.
The article provides a comprehensive analysis of Africa’s market for medicaments containing vitamins and provitamins from 2013-2024, with forecasts to 2035. In 2024, consumption reached 64K tons ($813M), led by Egypt, South Africa, and Kenya. Production was 45K tons ($621M), concentrated in Egypt, South Africa, and Kenya. The market is forecast to grow to 69K tons ($914M) by 2035, with a volume CAGR of +0.7% and a value CAGR of +1.1%. Key trends include significant import growth in the Democratic Republic of the Congo and high per capita consumption in Tunisia and Togo, while Egypt dominates both consumption value and exports.
Key Findings
Market forecast to reach 69K tons ($914M) by 2035, growing at a modest CAGR of +0.7% in volume and +1.1% in valueEgypt is the dominant market leader in both consumption value ($334M) and export value ($7.4M)Democratic Republic of the Congo shows the fastest import growth (+19.6% CAGR 2013-2024)Tunisia, Togo, and South Africa have the highest per capita consumption levelsExport prices surged 150% in 2024, with South Africa commanding the highest price at $40,444 per tonMarket Forecast
Driven by increasing demand for medicaments containing vitamins and provitamins in Africa, the market is expected to continue an upward consumption trend over the next decade. Market performance is forecast to decelerate, expanding with an anticipated CAGR of +0.7% for the period from 2024 to 2035, which is projected to bring the market volume to 69K tons by the end of 2035.
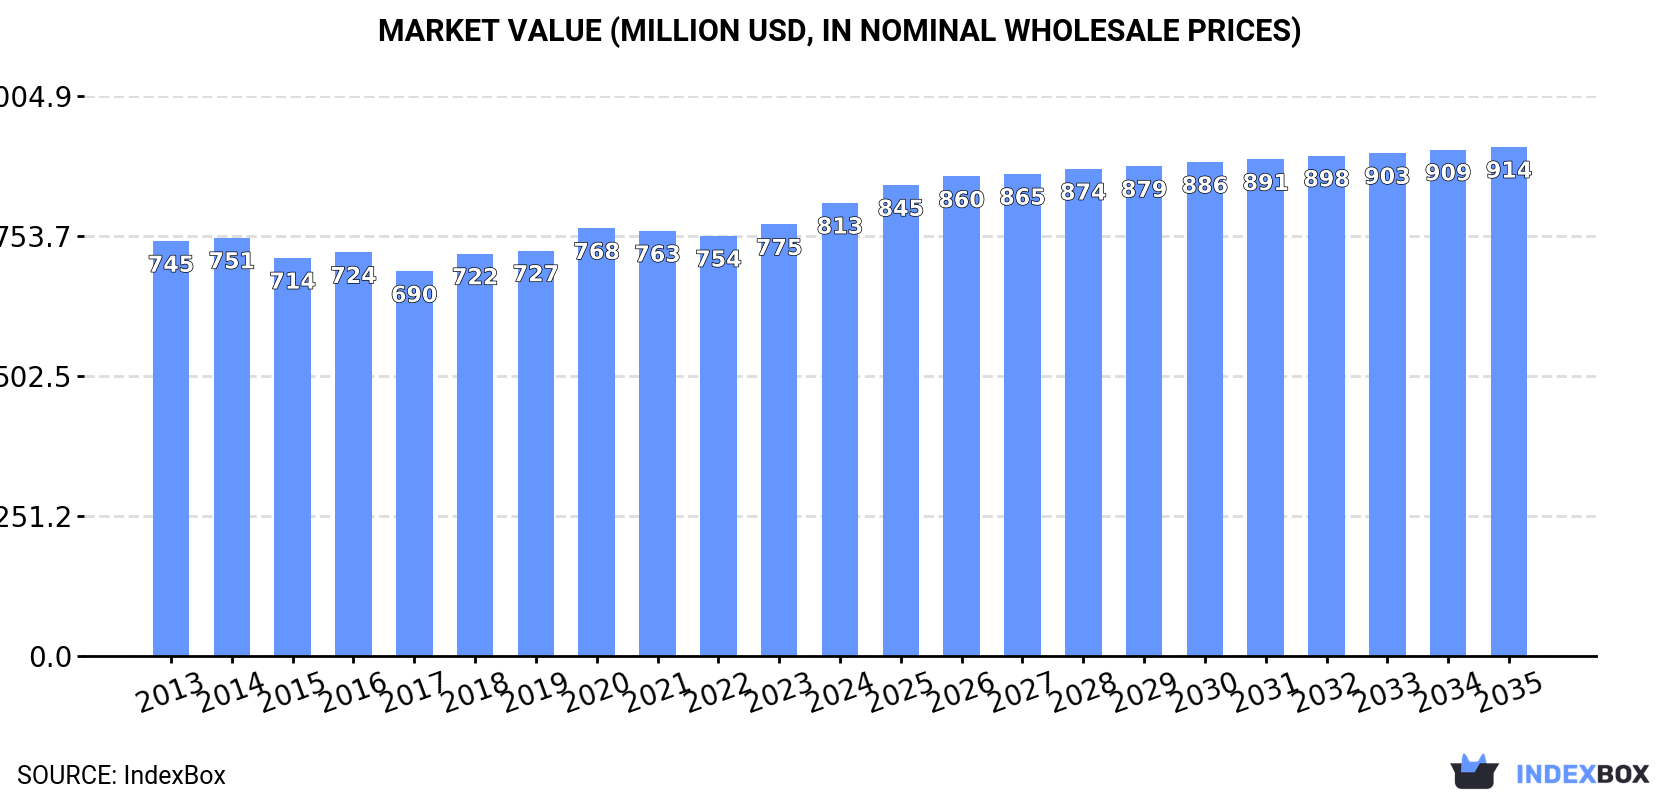
In value terms, the market is forecast to increase with an anticipated CAGR of +1.1% for the period from 2024 to 2035, which is projected to bring the market value to $914M (in nominal wholesale prices) by the end of 2035.
 ConsumptionAfrica’s Consumption of Medicaments Containing Vitamins And Provitamins
In 2024, consumption of medicaments containing vitamins and provitamins increased by 3.2% to 64K tons, rising for the second consecutive year after two years of decline. The total consumption volume increased at an average annual rate of +1.6% from 2013 to 2024; the trend pattern remained consistent, with only minor fluctuations being recorded throughout the analyzed period. The pace of growth was the most pronounced in 2020 when the consumption volume increased by 10% against the previous year. As a result, consumption reached the peak volume of 64K tons. From 2021 to 2024, the growth of the consumption remained at a lower figure.
The revenue of the medicaments containing vitamins market in Africa expanded to $813M in 2024, with an increase of 5% against the previous year. This figure reflects the total revenues of producers and importers (excluding logistics costs, retail marketing costs, and retailers’ margins, which will be included in the final consumer price). Overall, consumption continues to indicate a relatively flat trend pattern. The most prominent rate of growth was recorded in 2020 with an increase of 5.5%. The level of consumption peaked in 2024 and is expected to retain growth in the immediate term.
Consumption By Country
The countries with the highest volumes of consumption in 2024 were Egypt (16K tons), South Africa (13K tons) and Kenya (7.3K tons), together comprising 56% of total consumption. Tunisia, Senegal, Democratic Republic of the Congo, Togo, Cote d’Ivoire, Madagascar and Somalia lagged somewhat behind, together comprising a further 27%.
From 2013 to 2024, the biggest increases were recorded for Democratic Republic of the Congo (with a CAGR of +19.6%), while consumption for the other leaders experienced more modest paces of growth.
In value terms, Egypt ($334M) led the market, alone. The second position in the ranking was held by South Africa ($101M). It was followed by Tunisia.
In Egypt, the medicaments containing vitamins market expanded at an average annual rate of +4.3% over the period from 2013-2024. The remaining consuming countries recorded the following average annual rates of market growth: South Africa (+1.7% per year) and Tunisia (-1.6% per year).
The countries with the highest levels of medicaments containing vitamins per capita consumption in 2024 were Tunisia (284 kg per 1000 persons), Togo (244 kg per 1000 persons) and South Africa (205 kg per 1000 persons).
From 2013 to 2024, the most notable rate of growth in terms of consumption, amongst the key consuming countries, was attained by Democratic Republic of the Congo (with a CAGR of +15.8%), while consumption for the other leaders experienced more modest paces of growth.
ProductionAfrica’s Production of Medicaments Containing Vitamins And Provitamins
In 2024, approx. 45K tons of medicaments containing vitamins and provitamins were produced in Africa; surging by 5.8% against 2023. The total output volume increased at an average annual rate of +2.4% from 2013 to 2024; the trend pattern remained relatively stable, with only minor fluctuations being recorded in certain years. The pace of growth appeared the most rapid in 2018 with an increase of 7.5% against the previous year. The volume of production peaked in 2024 and is expected to retain growth in the immediate term.
In value terms, medicaments containing vitamins production stood at $621M in 2024 estimated in export price. The total output value increased at an average annual rate of +1.7% over the period from 2013 to 2024; the trend pattern remained relatively stable, with only minor fluctuations throughout the analyzed period. The most prominent rate of growth was recorded in 2018 when the production volume increased by 11%. The level of production peaked in 2024 and is likely to see steady growth in the near future.
Production By Country
The countries with the highest volumes of production in 2024 were Egypt (16K tons), South Africa (12K tons) and Kenya (6.9K tons), together accounting for 77% of total production. Senegal, Tunisia, Togo and Namibia lagged somewhat behind, together comprising a further 21%.
From 2013 to 2024, the most notable rate of growth in terms of production, amongst the leading producing countries, was attained by Senegal (with a CAGR of +3.7%), while production for the other leaders experienced more modest paces of growth.
ImportsAfrica’s Imports of Medicaments Containing Vitamins And Provitamins
In 2024, supplies from abroad of medicaments containing vitamins and provitamins decreased by -5.2% to 19K tons, falling for the third consecutive year after five years of growth. Over the period under review, imports continue to indicate a relatively flat trend pattern. The most prominent rate of growth was recorded in 2020 with an increase of 21%. Over the period under review, imports reached the maximum at 26K tons in 2021; however, from 2022 to 2024, imports remained at a lower figure.
In value terms, medicaments containing vitamins imports rose slightly to $196M in 2024. In general, imports saw a mild decline. The pace of growth appeared the most rapid in 2014 when imports increased by 22% against the previous year. As a result, imports reached the peak of $285M. From 2015 to 2024, the growth of imports remained at a somewhat lower figure.
Imports By Country
In 2024, Democratic Republic of the Congo (3.2K tons), followed by Cote d’Ivoire (2.1K tons), Madagascar (1.5K tons), Somalia (1.4K tons), Ghana (1.4K tons) and South Africa (0.9K tons) were the major importers of medicaments containing vitamins and provitamins, together generating 54% of total imports. The following importers – Nigeria (874 tons), Sierra Leone (845 tons), Libya (837 tons) and Uganda (528 tons) – together made up 16% of total imports.
From 2013 to 2024, the biggest increases were recorded for Democratic Republic of the Congo (with a CAGR of +19.6%), while purchases for the other leaders experienced more modest paces of growth.
In value terms, the largest medicaments containing vitamins importing markets in Africa were Cote d’Ivoire ($32M), South Africa ($17M) and Madagascar ($15M), with a combined 33% share of total imports.
Among the main importing countries, Madagascar, with a CAGR of +15.5%, saw the highest growth rate of the value of imports, over the period under review, while purchases for the other leaders experienced more modest paces of growth.
Import Prices By Country
In 2024, the import price in Africa amounted to $10,094 per ton, picking up by 7.8% against the previous year. Overall, the import price, however, continues to indicate a slight setback. The most prominent rate of growth was recorded in 2014 when the import price increased by 8.7% against the previous year. The level of import peaked at $13,168 per ton in 2016; however, from 2017 to 2024, import prices remained at a lower figure.
Prices varied noticeably by country of destination: amid the top importers, the country with the highest price was South Africa ($18,255 per ton), while Somalia ($1,912 per ton) was amongst the lowest.
From 2013 to 2024, the most notable rate of growth in terms of prices was attained by Nigeria (+6.4%), while the other leaders experienced mixed trends in the import price figures.
ExportsAfrica’s Exports of Medicaments Containing Vitamins And Provitamins
After three years of growth, shipments abroad of medicaments containing vitamins and provitamins decreased by -56.1% to 481 tons in 2024. Overall, exports showed a deep reduction. The most prominent rate of growth was recorded in 2014 with an increase of 41%. As a result, the exports attained the peak of 1.4K tons. From 2015 to 2024, the growth of the exports failed to regain momentum.
In value terms, medicaments containing vitamins exports expanded significantly to $14M in 2024. In general, exports, however, continue to indicate a notable increase. The most prominent rate of growth was recorded in 2016 when exports increased by 910% against the previous year. As a result, the exports attained the peak of $87M. From 2017 to 2024, the growth of the exports remained at a lower figure.
Exports By Country
Egypt represented the key exporter of medicaments containing vitamins and provitamins in Africa, with the volume of exports resulting at 182 tons, which was near 38% of total exports in 2024. Morocco (103 tons) held a 21% share (based on physical terms) of total exports, which put it in second place, followed by Tunisia (15%) and South Africa (13%). Algeria (20 tons), Namibia (13 tons) and Ghana (7.8 tons) held a relatively small share of total exports.
From 2013 to 2024, the most notable rate of growth in terms of shipments, amongst the leading exporting countries, was attained by Namibia (with a CAGR of +32.8%), while the other leaders experienced more modest paces of growth.
In value terms, Egypt ($7.4M) remains the largest medicaments containing vitamins supplier in Africa, comprising 52% of total exports. The second position in the ranking was held by South Africa ($2.6M), with an 18% share of total exports. It was followed by Morocco, with a 12% share.
In Egypt, medicaments containing vitamins exports increased at an average annual rate of +28.9% over the period from 2013-2024. In the other countries, the average annual rates were as follows: South Africa (-7.3% per year) and Morocco (+10.3% per year).
Export Prices By Country
The export price in Africa stood at $29,584 per ton in 2024, picking up by 150% against the previous year. Over the period under review, the export price posted a buoyant expansion. The pace of growth was the most pronounced in 2016 an increase of 904% against the previous year. As a result, the export price reached the peak level of $83,923 per ton. From 2017 to 2024, the export prices remained at a somewhat lower figure.
There were significant differences in the average prices amongst the major exporting countries. In 2024, amid the top suppliers, the country with the highest price was South Africa ($40,444 per ton), while Ghana ($1,414 per ton) was amongst the lowest.
From 2013 to 2024, the most notable rate of growth in terms of prices was attained by Egypt (+31.3%), while the other leaders experienced more modest paces of growth.
Source: IndexBox Market Intelligence Platform
This report provides a comprehensive view of the medicaments containing vitamins industry in Africa, tracking demand, supply, and trade flows across the regional value chain. It explains how demand across key channels and end-use segments shapes consumption patterns, while also mapping the role of input availability, production efficiency, and regulatory standards on supply.
Beyond headline metrics, the study benchmarks prices, margins, and trade routes so you can see where value is created and how it moves between exporters and importers within Africa. The analysis is designed to support strategic planning, market entry, portfolio prioritization, and risk management in the medicaments containing vitamins landscape in Africa.
Quick navigation
Key findings
Regional demand is shaped by both household and industrial usage, with trade flows linking supply hubs to import-reliant countries.
Pricing dynamics reflect unit values, freight costs, exchange rates, and regulatory shifts that affect sourcing decisions.
Supply depends on input availability and production efficiency, creating distinct cost curves across Africa.
Market concentration varies by country, creating different competitive landscapes and entry barriers.
The 2035 outlook highlights where capacity investment and demand growth are most aligned within the region.
Report scope
The report combines market sizing with trade intelligence and price analytics for Africa. It covers both historical performance and the forward outlook to 2035, allowing you to compare cycles, structural shifts, and policy impacts across countries and sub-regions.
Market size and growth in value and volume terms
Consumption structure by end-use segments and countries
Production capacity, output, and cost dynamics
Regional trade flows, exporters, importers, and balances
Price benchmarks, unit values, and margin signals
Competitive context and market entry conditions
Product coverageProdcom 21201360 – Medicaments containing vitamins, provitamins, derivatives and intermixtures thereof, for therapeutic or prophylactic uses, put up in measured doses or for retail saleCountry coverageCountry profiles and benchmarks
For the regional report, country profiles provide a consistent view of market size, trade balance, prices, and per-capita indicators across Africa. The profiles highlight the largest consuming and producing markets and allow direct benchmarking across peers.
Methodology
The analysis is built on a multi-source framework that combines official statistics, trade records, company disclosures, and expert validation. Data are standardized, reconciled, and cross-checked to ensure consistency across time series.
International trade data (exports, imports, and mirror statistics)
National production and consumption statistics
Company-level information from financial filings and public releases
Price series and unit value benchmarks
Analyst review, outlier checks, and time-series validation
All data are normalized to a common product definition and mapped to a consistent set of codes. This ensures that comparisons across time are aligned and actionable.
Forecasts to 2035
The forecast horizon extends to 2035 and is based on a structured model that links medicaments containing vitamins demand and supply to macroeconomic indicators, trade patterns, and sector-specific drivers. The model captures both cyclical and structural factors and reflects known policy and technology shifts within Africa.
Historical baseline: 2012-2025
Forecast horizon: 2026-2035
Scenario-based sensitivity to income growth, substitution, and regulation
Capacity and investment outlook for major producing countries
Each country projection is built from its own historical pattern and the regional context, allowing the report to show where growth is concentrated and where risks are elevated.
Price analysis and trade dynamics
Prices are analyzed in detail, including export and import unit values, regional spreads, and changes in trade costs. The report highlights how seasonality, freight rates, exchange rates, and supply disruptions influence pricing and margins.
Price benchmarks by country and sub-region
Export and import unit value trends
Seasonality and calendar effects in trade flows
Price outlook to 2035 under baseline assumptions
Profiles of market participants
Key producers, exporters, and distributors are profiled with a focus on their operational scale, geographic footprint, product mix, and market positioning. This helps identify competitive pressure points, partnership opportunities, and routes to differentiation.
Business focus and production capabilities
Geographic reach and distribution networks
Cost structure and pricing strategy indicators
Compliance, certification, and sustainability context
How to use this report
Quantify regional demand and identify the most attractive country markets
Evaluate export opportunities and prioritize target destinations
Track price dynamics and protect margins
Benchmark performance against regional competitors
Build evidence-based forecasts for investment decisions
This report is designed for manufacturers, distributors, importers, wholesalers, investors, and advisors who need a clear, data-driven picture of medicaments containing vitamins dynamics in Africa.
FAQ
What is included in the medicaments containing vitamins market in Africa?
The market size aggregates consumption and trade data at country and sub-regional levels, presented in both value and volume terms.
How are the forecasts to 2035 built?
The projections combine historical trends with macroeconomic indicators, trade dynamics, and sector-specific drivers.
Does the report cover prices and margins?
Yes, it includes export and import unit values, regional spreads, and a pricing outlook to 2035.
Which countries are profiled in detail?
The report provides profiles for the largest consuming and producing countries in Africa.
Can this report support market entry decisions?
Yes, it highlights demand hotspots, trade routes, pricing trends, and competitive context.


