

General observations
All animals completed the experimental period with no mortality. Rats in the control group exhibited normal activity and consistent physiological appearance. No abnormal behavior was observed in either intervention group.
Effects on body weight gain
The recorded initial body weight (IBW) mean values of all experimental groups were similar, with no statistically significant variation, ranging from 190 to 225 g. However, the mean final body weight (FBW) significantly increased in the HFD group compared to the control group. There was no significant variation in the average FBW between the control and HFD + VD groups. In contrast, the HFD + IF group exhibited a significant reduction in mean FBW compared to the control group. Both the HFD + VD and HFD + IF groups showed lower significant measures compared to the HFD group, with the HFD + IF group exhibiting lower significant measures compared to the HFD + VD group (Fig. 1).
Fig. 1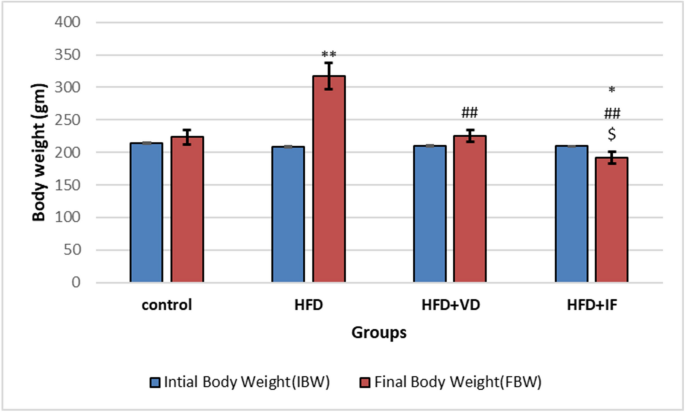
The study groups’ mean initial and final body weight (g) values. * Significant (P < 0.05) as compared to control group. # Significant (P < 0.05) as compared to the HFD group. $ Significant (P < 0.05) as compared to HFD + VD group.
Biochemical profilesBlood glucose and serum insulin levels
HFD feeding resulted in a significant elevation in fasting blood glucose (FBG) and a reduction in serum insulin compared with the control group (p < 0.05). Vitamin D and IF markedly attenuated hyperglycemia, reducing FBG by approximately 52% and 55%, respectively, compared with HFD (p < 0.05). Mean glucose values decreased from HFD to VD and, respectively (Fig. 2A).
Fig. 2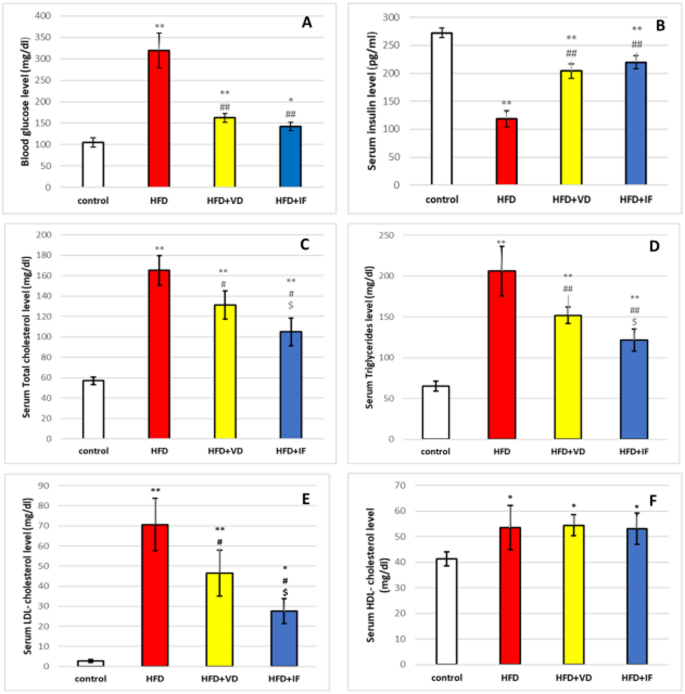
Blood glucose level (A), Serum levels of insulin (B), total cholesterol (C), triglycerides (D), LDL-cholesterol (E) and HDL-cholesterol (F) in control and experimental groups. * Significant (P < 0.05) as compared to control group. # Significant (P < 0.05) as compared to the HFD group. $ Significant (P < 0.05) as compared to HFD + VD group.
Serum insulin, significantly reduced in the HFD group (p < 0.05), was restored by ~ 53% in the HFD + VD group and ~ 60% in the HFD + IF group (p < 0.05 vs. HFD), with no significant difference between the two interventions (Fig. 2B).
Lipid metabolic parameters
HFD-fed rats showed significant elevations in serum total cholesterol (TC), triglycerides (TG), and LDL-C compared with the control group (p < 0.05). Vitamin D reduced TC by ~ 21%, TG by ~ 29%, and LDL-C by ~ 44%, while IF produced a more pronounced reduction of ~ 32%, ~ 38%, and ~ 56%, respectively (p < 0.05 vs. HFD for all). HDL-C increased modestly in both intervention groups, rising ~ 20% in HFD + VD and ~ 10% in HFD + IF (p < 0.05 vs. HFD) (Figs. 2C–F).
Effect on liver functions
Serum ALT and AST were significantly elevated in the HFD group (p < 0.05). Vitamin D reduced ALT and AST by ~ 36% and ~ 32% relative to HFD, respectively, while intermittent fasting produced reductions of ~ 30% and ~ 36% (p < 0.05). ALT in the IF group did not differ significantly from the control group (p > 0.05), whereas AST remained slightly elevated compared with control (p < 0.05) (Figs. 3A–B).
Fig. 3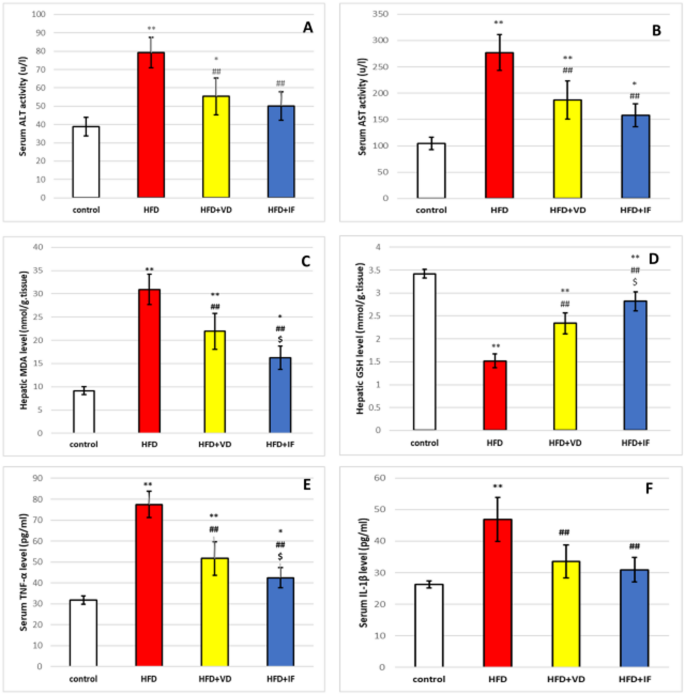
Serum levels of ALT (A), AST (B), MDA (C), GSH (D), TNF α (E) and IL1β (F) in control and experimental groups. * Significant (P < 0.05) as compared to control group. # Significant (P < 0.05) as compared to the HFD group. $ Significant (P < 0.05) as compared to HFD + VD group.
Oxidative stress and inflammatory markers
HFD feeding resulted in a significant rise in serum MDA and a marked reduction in GSH levels (p < 0.05). Vitamin D decreased MDA by ~ 32%, while IF induced a stronger reduction of ~ 41% (p < 0.05 vs. HFD) (Fig. 3C). GSH levels increased by ~ 64% with vitamin D and by ~ 96% with IF, indicating superior antioxidant restoration in the fasting group (p < 0.05) (Fig. 3D).
Pro-inflammatory cytokines TNF-α and IL-1β were significantly elevated in HFD-fed rats (p < 0.05). Vitamin D reduced TNF-α by ~ 38%, while IF produced a more pronounced reduction of ~ 46%. IL-1β declined by ~ 31% with vitamin D and ~ 33% with IF (p < 0.05 vs. HFD for both) (Figs. 3E–F).
Hepatic histological featuresHematoxylin and Eosin staining results
Control liver sections showed normal hepatic cords, preserved nuclei, and intact sinusoidal architecture (Fig. 4A). HFD-fed rats exhibited extensive macrovesicular and microvesicular steatosis, inflammatory infiltrates near portal tracts, sinusoidal dilation, and occasional hepatocellular ballooning (Fig. 4B).
Fig. 4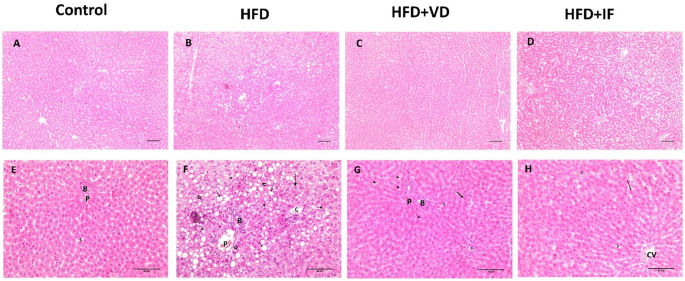
Photomicrographs of liver sections stained with H&E. A & E: The control group shows normal liver architecture, with hepatocytes exhibiting central rounded vesicular nuclei. Hepatic blood sinusoids (S) are radially arranged between hepatic cords. Normal bile duct (B) is observed in the portal area (P). B & F: The HFD group shows widespread macrovesicular lipid globules (black arrows) with squeezed nuclei into the thin rim of cytoplasm in some hepatocytes, others with microvesicular lipid droplets (arrowheads). Inflammatory cellular infiltration (curved arrows) appears near congested and dilated portal veins (P) and blood vessels (c) with slightly dilated blood sinusoids (S). Some hepatocytes exhibit cytoplasmic vacuolation with pyknotic nuclei (Doted arrow). C & G: The HFD + VD group shows normal hepatocytes (black arrow), and few cells show moderate microvesicular lipid droplets (arrowheads). Normal appearance of portal vein (P), mild dilated blood sinusoids (S) and mild enlarged blood vessels (c) can be seen. D & H: HFD + IF displays a normal structural pattern of tissue and a normal appearance of hepatocytes radiating around a central vein (CV); some cells appear binucleated (black arrows). Normal blood sinusoids (S) and blood vessels (c) can be noticed. [A, B,C & D: x100, E, F,G & H: x400, Scale bar; 50 μm].
Vitamin D ameliorated these alterations, showing predominantly normal hepatocytes with only mild microvesicular steatosis (Fig. 4C). IF restored nearly normal lobular architecture with minimal fat deposition and occasional binucleated hepatocytes, indicating high regenerative capacity (Fig. 4D).
A semi-quantitative steatosis score revealed:
HFD significantly > control (p < 0.05).
HFD + VD and HFD + IF both < HFD (p < 0.05), with IF showing the lowest scores.
Oil red stain results
Oil Red O staining showed minimal lipid droplets in the control group (Fig. 5A).
Fig. 5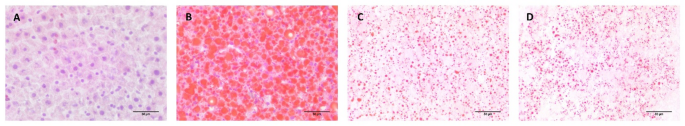
Oil red O stained sections. (A) The control group shows mild red Oil-stained lipid droplets and (B) HFD group displays a massive increase in the red Oil-stained lipid droplets. (C&D) HFD + VD and HFD + IF groups show moderate red Oil-stained lipid droplets. [Oil red O: x400, Scale bar; 50 μm].
A marked increase was observed in HFD, with lipid accumulation significantly elevated (p < 0.05).
Both vitamin D and IF reduced hepatic lipid deposition; quantitative area analysis showed moderate but significant reductions compared with HFD (p < 0.05). IF showed a slightly greater decrease than vitamin D (Figs. 5B–D).
Protein expression of hepatic lipid metabolizing molecules
Immunohistochemistry revealed mild expression of AQP9 and SREBP1 in control hepatocytes (Fig. 6A and E).
Fig. 6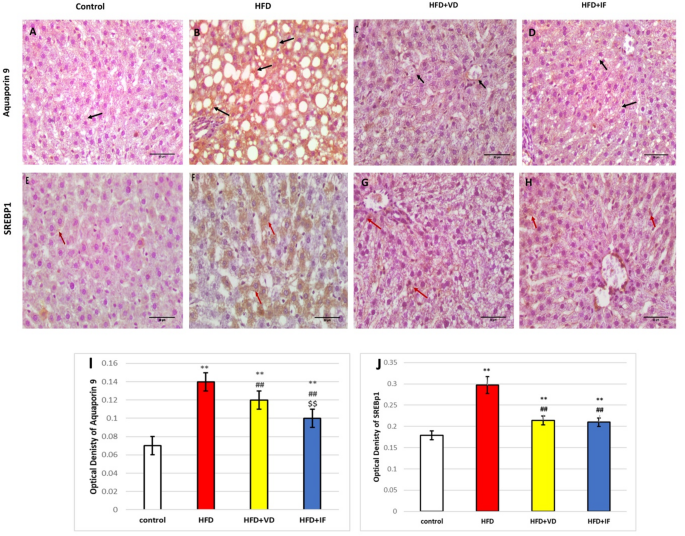
(A-D) Photomicrograph of immunohistochemical staining sections for aquaporin 9 of the liver tissues of control, HFD, HFD + VD and HFD + IF groups (A, B, C and D respectively), immunostained hepatocytes (black arrows) and immunostained endothelial cells lining the blood sinusoids (red arrows). [aquaporin-9 immunostaining: x400, Scale bar; 50 μm]. (E-H) Photomicrograph of Immunohistochemical staining sections for SREBP1 in liver sections of control, HFD, HFD + VD and HFD + IF groups (A, B, C and D respectively), [SREBP1 immunostaining: x400, Scale bar; 50 μm]. (I) diagram of the optical density immunoreaction of aquaporin 9 in the liver sections of the different groups. (J) Diagram of SREBP1 optical density immunoreaction in the liver sections of the different groups. * Significant (P < 0.05) as compared to control group. # Significant (P < 0.05) as compared to the HFD group. $ Significant (P < 0.05) as compared to HFD + VD group.
HFD markedly increased cytoplasmic expression of both markers (p < 0.05), reflecting enhanced glycerol influx and lipogenic activity (Fig. 6B and F).
Vitamin D reduced AQP9 expression by ~ 17% compared with HFD (p < 0.05), while IF resulted in a ~ 25% reduction (p < 0.05).
Optical density values confirmed significantly lower AQP9 expression in both intervention groups versus HFD, with AQP9 staining shown in Figs. 6C–D for the vitamin D and IF groups, respectively.
Intermittent fasting produced a significant reduction in AQP9 expression compared with HFD, although the histological staining intensity remained moderate and visually comparable to the vitamin D group (Fig. 6I).
Similarly, SREBP1 expression increased by ~ 68% in the HFD group relative to the control (p < 0.05).
Vitamin D and IF reduced SREBP1 by ~ 25% and ~ 28%, respectively (p < 0.05 vs. HFD), demonstrating effective down-regulation of lipogenesis.
Representative SREBP1 staining patterns for each group are shown in Figs. 6G–H, with quantification depicted in Fig. 6J.
Effect on hepatic NF-κB and TLR-4 immunoreactivity
NF-κB and TLR-4 showed minimal immunoreactivity in the control group (Fig. 7A and E).
Fig. 7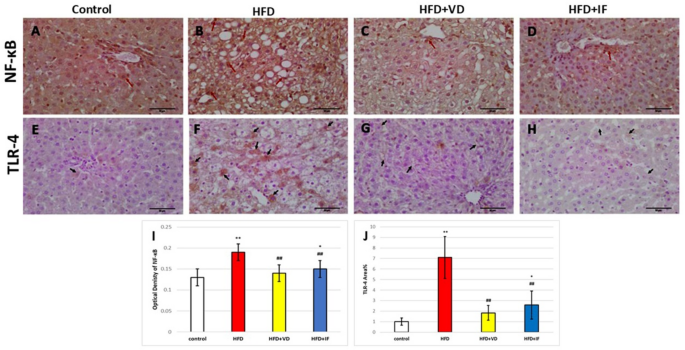
Photomicrograph of immunohistochemical staining sections for NF-κB (A, B, C and D, respectively) and TLR-4 (E, F, G and H, respectively) of the liver tissues of control, HFD, HFD + VD and HFD + IF groups, immunostained hepatocytes (red arrows). [immunostaining: x400, Scale bar; 50 μm]. (I) diagram of the NF-κB optical density immunoreaction in the liver samples of the different groups. (J) Diagram of area fraction of TLR-4 immunoreactivity in the liver sections of the different groups. * Significant (P < 0.05) as compared to control group. # Significant (P < 0.05) as compared to the HFD group.
Both markers were markedly upregulated in the HFD group (p < 0.05), indicating strong activation of inflammatory pathways (Fig. 7B and F).
Vitamin D and IF significantly lowered NF-κB activation compared with HFD (p < 0.05), with IF showing slightly greater reduction (Fig. 7C–D and I).
Similarly, TLR-4 expression was significantly reduced in both intervention groups (p < 0.05), with representative staining displayed in Figs. 7G–H, supporting the attenuation of TLR4/NF-κB signaling (Fig. 7J).


