

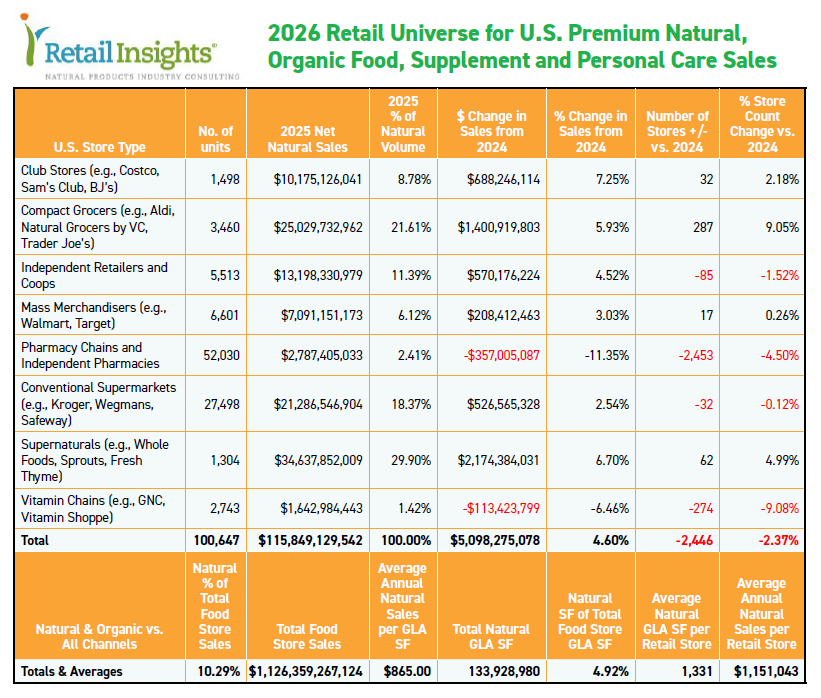
Each year, Retail Insights updates its database of U.S. grocers in eight retail channels including conventional supermarkets, large “supernatural” specialty grocers, club stores, mass merchants, independent natural retailers and coops, pharmacies, vitamin chains, and “compact grocers,” a term we coined in 2012 signifying those retailers operating in up to 20,000 square feet. Please see the table below for performance details on each, and read on for the 2026 market share rankings for natural organic products, by retail channel.
p.p1 {margin: 13.5px 0.0px 9.0px 0.0px; line-height: 18.0px; font: 16.0px Helvetica; color: #37fb02} p.p2 {margin: 4.5px 0.0px 0.0px 0.0px; line-height: 12.0px; font: 9.5px Helvetica} p.p3 {margin: 0.0px 0.0px 0.0px 0.0px; text-indent: 18.0px; font: 9.5px Helvetica} p.p4 {margin: 0.0px 0.0px 0.0px 0.0px; font: 9.5px Helvetica} span.s1 {letter-spacing: -0.1px} span.s2 {letter-spacing: -0.1px; color: #ff951b}
]]>
Supernaturals—No. 1
$34.6 billion—29.9% market share—6.7% y-o-y growth
Large natural supermarkets including Whole Foods Market, Sprouts, Fresh Thyme, and others, continue to capture the largest market share. The sector added 62 stores, 52 of which were Sprouts, followed by seven Whole Foods Markets. Six openings spread across five other supernaturals, while southeastern retailer, Earthfare, closed three stores, leaving it with 16 units.
Sprouts was by far the largest gainer in the sector, adding $1.3 billion between new- and same-store sales increases. Next, we put Whole Foods’ physical store sales increase at $450 million and estimate a $326 million increase in Amazon Prime orders selected from Whole Foods’ locations.
In 2017, when Amazon acquired Whole Foods, the stores were on track to reach $16 billion in sales. In January of this year, Amazon revealed Whole Foods’ sales have grown 40% since then, putting annual sales at $22.4 billion today. We believe this includes about $3 billion in Amazon Prime orders fulfilled from Whole Foods’ locations, which leaves $3 billion, or about 18% growth in physical store sales, or just over 2% per year. Underwhelming, and trailing inflation. But this is not surprising, as the depletion of the brand’s expert staff and diminished discernment in the assortment has failed to inspire a new generation of Whole Foodies.
Also in January, Amazon announced it is closing all remaining Amazon Fresh and Amazon Go markets, claiming an inability to generate sufficient traffic. Instead, the company intends to open 100 Whole Foods stores, some of which will be small, urban, or college-town Daily Shop formats. Although Amazon is calling these stores Whole Foods, shoppers at Whole Foods that also want conventional grocery items such as Pepsi can already request these items. Robots in the back room will marry these conventional items with their Whole Foods shopping carts. So, the dilution continues.
 Sprouts added $1.3B with new-and same-store sales increases.
Amazon isn’t restricting its bricks-and-mortar efforts to Whole Foods. It recently announced plans for a 230,000-square-foot mega-store in the Chicago area, adjacent to a 178,000-square-foot Walmart Supercenter, a 144,000-square-foot Costco, and a Super Target. We remain skeptical and believe Amazon will not find bricks-and-mortar salvation trying to out-Walmart Walmart, or out-Costco Costco.
Compact Grocers—No. 2
$25 billion—21.6% market share—5.93% y-o-y growth
Compact grocers are their own category because their relatively smaller size compared to 50,000-square-foot conventional supermarkets enables them to access many more prime retail locations than their larger brethren. The segment added 287 units this year, 264 of which were Aldi, followed by 23 Trader Joe’s.
 The sector added 287 units this year, 264 of which were Aldi.Aldi’s flexible assortment adds natural and organic options in receptive trade areas, and even though natural accounts for a small percentage of Aldi’s total sales, we have the chain adding just under $300 million in natural sales this year. Trader Joe’s is the whale in the compact grocer sector, adding nearly $1 billion in natural volume, the bulk of the sector’s increase. Natural Grocers continues its multi-year growth streak, tacking on about $90 million to reach $1.33 billion this year.
Conventional Supermarkets—No. 3
$21.3 billion—18.37% market share—2.54% y-o-y growth
Market leader Kroger shed 35 units this year but still added about $75 million in natural sales, followed by Wegmans, which added three stores and an estimated $29 million in new- and same-store natural sales. Together, this accounted for about 20% of the sector’s annual growth. The remaining $422 million in natural growth was spread across the industry’s 24,000 or so regional chains and independents.
Natural Independents & Coops—No. 4
$13.2 billion—11.39% market share—4.52% y-o-y growth
Even though the sector lost 85 independent units this year, about 1.5% of the total, the remaining stores rose at a robust 6.1% annual growth rate, salvaging 4.52% growth, and adding $570 million in natural sales. See the 48th Annual Retailer Survey on the preceding pages for a detailed analysis of the independent retail sector’s results.
Club Stores—No. 5
$10.17 billion—8.78% market share—7.25% y-o-y growth
Club stores, including Costco, Sam’s, and BJ’s Wholesale, at 7.25%, posted the fastest year-over-year natural growth of all eight channels. Costco added 23 stores this year, the bulk of the sector’s 32-unit increase, with BJ’s and Sam’s adding 6 and 3 units, respectively.
With its 640 U.S. stores and deep commitment to natural and organic products, especially fresh proteins and produce, Costco accounted for the lion’s share of the sector’s growth, adding $642 million of the channel’s total $688 million increase.
 Costco claimed the lion’s share of natural club store sector growth.
Sam’s Club was no slouch, however, adding $39 million in natural volume. BJ’s rounded out the sector, with $7 million in new natural sales.
Mass Merchants—No. 6
$7.1 billion—6.12% market share—3.03% y-o-y growth
For its 6,601 total units, the mass channel was remarkably stable this year, adding only a net 17 new stores, most of which were Target’s 124,000-square-foot average expanded food assortment formats, about 50,000 square feet smaller than the company’s Super Target format. The increase in Target’s store count couldn’t offset its year-over-year (-1.7%) corporate sales decline, shedding about (-$30 million) in natural sales.
It was Walmart that picked up the sector’s natural slack, adding about $240 million in natural sales, the bulk of which came through the company’s supercenter format. Walmart’s 45,000-square-foot neighborhood formats contributed an estimated $23 million of that total.
Pharmacy Chains and Independent Pharmacies—No. 7
$2.78 billion—2.41% market share—(-11.35%) y-o-y growth
Continuing its yearslong sloughing-off, chain and independent pharmacies shrank by 2,453 units, half of which (1,262 units) were the last gasp of Rite Aid as it shut all its doors by year-end, 2025. Independent pharmacies were not immune, decreasing by 609 units, and Walgreens, which was taken private in August by Sycamore Partners, lost 426 units across the country. Rounding out the sector, CVS contracted its store count by 159 units.
 The bulk of the pharmacy sector’s $357 million loss in natural sales came from Rite Aid.
The bulk of the sector’s $357 million loss in natural sales came from Rite Aid, down $263 million. Walgreen lost an estimated $77 million in natural volume, and CVS dropped by an estimated $7 million.
Vitamin Chains—No. 8
$1.64 billion—1.42% market share—(-6.46%) y-o-y growth
The vitamin chain sector also continued to justify its store counts, with GNC dropping by 225 units, and Vitamin Shoppe closing 47 stores. Vitamin World, still here, closed the year with 57 stores. We estimate GNC shrank by $74 million, and Vitamin Shoppe by $40 million. Both chains’ digital sales were unable to offset these losses.
Summary
Overall, in the Retail Universe this year, food retailers across all eight channels closed 2,446 stores, bringing the number we are tracking to 100,647, down from 103,093 last year. Natural market share of total food-store sales remained nearly the same as last year: 10.29% this year vs. 10.31% a year ago.
Average annual natural sales per gross lease area (GLA) square foot rose by $57 to $865 from $808 last year. Average annual natural sales per retail store, across all 100,647 stores we track, rose to $1.15 million, up from $1.07 million last year, out of an average 1,331 GLA square feet. Both average natural total sales and sales per GLA square foot were records in the Retail Universe.
Natural foods continue to punch above their weight, accounting for just 4.92% of total food-store GLA square footage but generating 10.29% of total food-store sales overall, or $115.8 billion.
A Word About Total Food Store Sales
As you can see from the accompanying table, the 2026 Retail Insights’ Retail Universe is carrying $1.126 trillion in total U.S. food store sales. We believe that this number includes some non-foods offered by conventional supermarkets and by the club-store channel.
While we can isolate the food portion of sales for, say, Walmart, the same is not true for conventional grocers overall. We estimate that the non-food portion of the total we are carrying may approach 20%. This implies that the pure food total may more accurately be stated closer to $900 million. If this is true, the natural portion of total food-store sales may reach 13%, and not 10%. WF


