

Screening of mitochondria-associated pan-cell death genes (MAPGs) in OSCC
To investigate the cell type-specific expression patterns of mitochondria-associated pan-cell death-related genes (MAPGs) in OSCC, we analyzed single-cell RNA sequencing (scRNA-seq) data (Fig. 2A, S1). Using the UMAP algorithm, we classified the major cell populations into four principal compartments: epithelial cells, endothelial cells, fibroblasts, and immune cells (Fig. 2A,B). Comparative analysis revealed an expansion of immune and epithelial cell compartments in OSCC tissues compared to paracancerous tissues, whereas fibroblast and endothelial cell compartments were reduced (Fig. 2C,D). AUCell scoring demonstrated active expression of both mitochondrial-related genes (MIGs) and pan-cell death-related genes (PCDGs) particularly in epithelial cells and fibroblasts of OSCC (Fig. 2E). Differential expression analysis of MIGs and PCDGs was visualized using volcano plots (Fig. 2F,G). By integrating correlation analysis, LASSO regression, and multivariate Cox regression, we identified 19 mitochondria-associated pan-cell death genes (MAPGs) with significant prognostic value for OSCC patients (Fig. 2H–K). However, the correlation between MAPGs expression and clinical features in OSCC still needed further analysis.
Fig. 2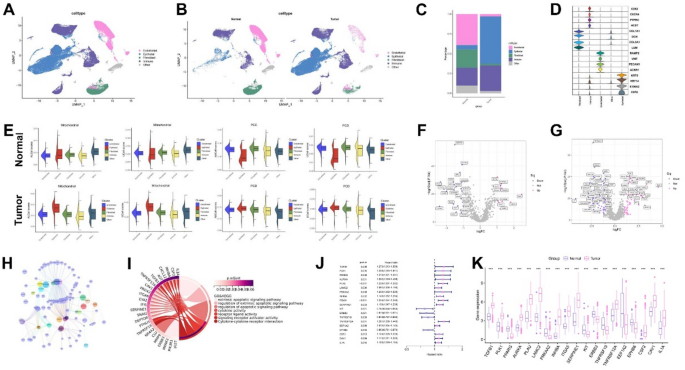
Screening of major cell types and mitochondria-associated pan-cell death genes (MAPGs) in OSCC. (A) UMAP visualization of major cell types. (B) UMAP plots contrasting normal and malignant cells in OSCC. (C) Bar graph depicting the relative proportions of cell types. (D) Marker genes expressed within the four major cell compartments. (E) Scores of OSCC related to mitochondrial and cell death processes in normal and malignant cells. (F) Volcano plot illustrating differentially expressed mitochondria-related genes (MIGs) in OSCC. (G) Volcano plot showing differentially expressed pan-cell death-related genes (PCDGs) in OSCC. (H) Correlation analysis between MIGs and PCDGs. (I) The gene functional enrichment analysis (GO and KEGG analysis). (J) Univariate Cox regression analysis identifying 19 MAPGs significantly associated with prognosis. (K) Expression levels of MAPGs in normal group and HNSCC group. GO, Gene Ontology; KEGG, Kyoto Encyclopedia of Genes and Genomes. *p < 0.05, **p < 0.01, ***p < 0.001, ****p < 0.0001.
OSCC subtype analysis based on MAPGs
To explore the prognostic relevance of MAPGs, we performed unsupervised consensus clustering and categorized all OSCC samples into two distinct subtypes (C1 and C2) (FigS2.A-I; Fig. 3A). Principal component analysis (PCA) confirmed clear separation between the two subtypes (Fig. 3B). Kaplan-Meier survival analysis revealed that patients in the C2 subtype had significantly better survival outcomes than those in C1 (Fig. 3C).
Fig. 3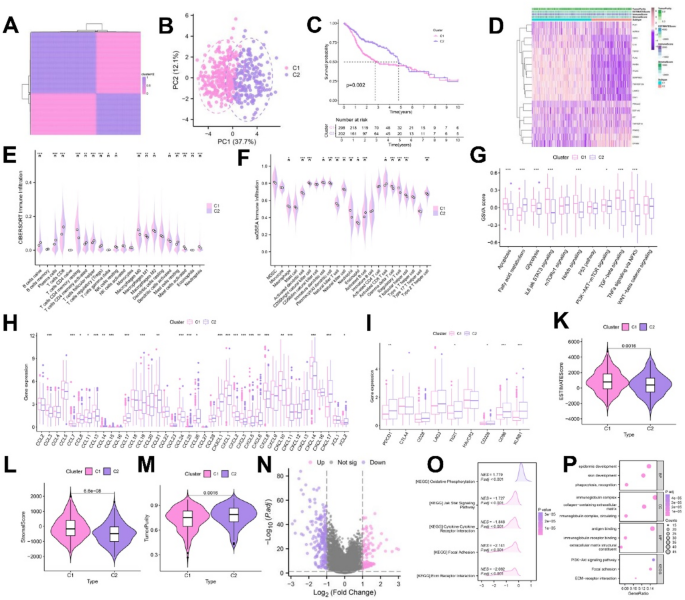
Analysis of OSCC subtypes based on MAPGs. (A) Two MAPGs-related molecular clusters were identified by NMF cluster analysis. (B) PCA analysis of distinct MAPGs-related molecular clusters. (C) Kaplan-Meier curve of differential survival between C1 and C2 groups. (D) Heatmap of the relationship between ESTIMATE scores, GSVA, and different cohorts of the two clusters. (E–G) Differences in the expression of immune infiltrating cells and immune related functions based on ssGSEA and CIBERSORT between the two clusters. (H) Expression differences of chemokine related genes between the two clusters. (I) Expression differences of immune checkpoint related genes between the two clusters. (K–M) ESTIMATEcore, StromalScore and TumorPurity for two clusters. (N) Volcano plot showing differentially expressed MAPGs in OSCC. (O,P) GO and KEGG enrichment analysis. *p < 0.05, **p < 0.01, ***p < 0.001, ****p < 0.0001.
We further characterized the tumor microenvironment (TME) differences between MAPGs-based subtypes. Subtype C1 was enriched with T cells CD4 memory resting, NK cells resting, macrophages, dendritic cells activated, mast cells activated and neutrophils. C2 group enriched B cells naive, plasma cells, T cells CD8, T cells CD4 memory activated, T cells regulatory and mast cells resting (Fig. 3E,F). Single-sample gene set enrichment analysis (ssGSEA) revealed that apoptosis, glycolysis, IL6-JAK-STAT3 signaling, Notch signaling, PI3K-AKT-mTOR signaling, TGF-β signaling, and TNFα signaling via NF-κB were significantly enriched in C1 (Fig. 3G). Compared with C2, C1 showed higher expression of chemokine-related genes (CCL3, CCL7, CCL8, CCL11, CCL13, CCL21, CCL24, CCL26, CXCL1, CXCL2, CXCL3, CXCL5, CXCL6, CXCL10, CXCL11, CXCL14) and increased CTLA4 expression (Fig. 3H,I). Combined with the immune score results, we found that the immune score was higher in C1 (Fig. 3D,K–M), suggesting the presence of an immunosuppressive TME, which may contribute to its poorer prognosis, while C1 might be more sensitive to immunotherapy. The results of GO enrichment analysis and KEGG pathway analysis showed that molecular metabolism, protein binding and PI3K-AKT signaling pathways were more prominent in C1 group (Fig. 3O,P). Collectively, these results suggested that key MAPGs might promote the progression of OSCC by regulating the tumor immune microenvironment, although the specific mechanism requires further exploration.
Identification of key prognostic MAPG using machine learning approaches
We used nine machine learning algorithms, namely Gradient Boosting (GB), Gradient Boosting with Cross-Validation (GB-CV), Gradient Boosting Machines (GBM), Linear Discriminant Analysis (LDA), Linear Discriminant Analysis with Cross-Validation (LDA-CV), Random Forest (RF), Support Vector Machine (SVM), Support Vector Machine with Cross-Validation (SVM-CV) and LASSO regression to identify the importance of MAPGs (Fig. 4A–J, Table.S2). Based on the nine machine learning algorithms described above, overlapping genes (INHBA, TNFRSF19, and PRKAA2) were selected as potent prognostic factors and visualized using flower plots (Fig. 4K). Their importance was further examined with various algorithms (Fig. 4L–R). Multiple database analyses revealed that TNFRSF19 and PRKAA2 were underexpressed in HNSCC. Survival analysis indicated that patients with low expression of TNFRSF19 and PRKAA2 had a more favorable prognosis. We further validated the expression of INHBA, TNFRSF19, and PRKAA2 using quantitative PCR (qPCR). The results showed that INHBA exhibited the most pronounced differential expression among the three genes. (Fig. S3, Fig. 5C) Consequently, TNFRSF19 and PRKAA2 were excluded, highlighting the more crucial role of INHBA in OSCC. Ultimately, we screened out the pivotal prognostic gene INHBA, which is associated with mitochondrial pan-cell death.
Fig. 4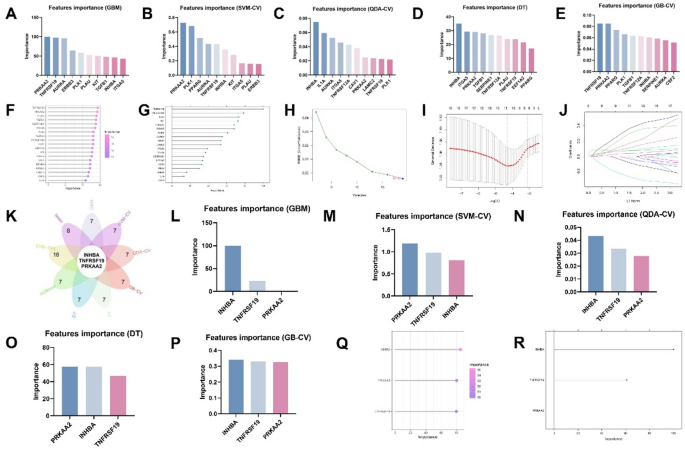
Screening the most critical MAPG in OSCC using multiple machine learning. (A–J) Importance of MAPGs evaluated by multiple machine learning algorithms. (K) Flower plot showing overlapping genes (INHBA, TNFRSF19 and PRKAA2) based on nine machine learning algorithms. (L–R) Assessment of the significance of INHBA, TNFRSF19, and PRKAA2 using various machine learning algorithms.
Fig. 5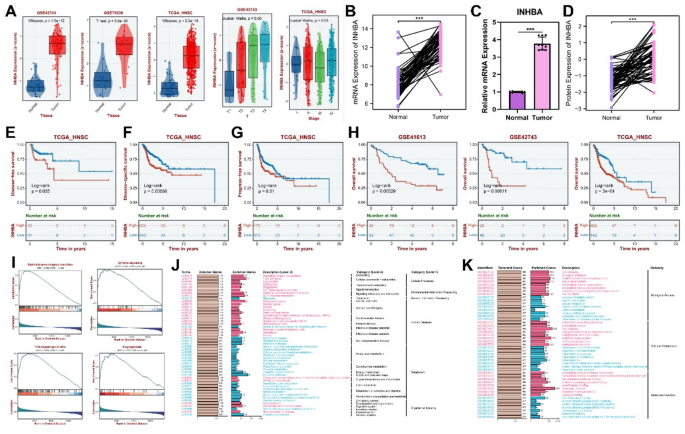
Expression, prognostic and functional analysis of INHBA. (A,B,D) The expression levels of INHBA in validation set GSE42743, GSE75538 and TCGA_HNSC. (C) The expression level of INHBA detected by RT-qPCR in clinical sample. (E) Kaplan-Meier curve to show the disease-free survival of HNSCC patients in low INHBA expression and high INHBA expression subgroups. (F) Kaplan–Meier Curves for disease-specific survival of INHBA high-expression and INHBA low-expression subgroups. (G) Kaplan-Meier curve to show the progress-free survival of HNSCC patients in low INHBA expression and high INHBA expression subgroup. (H) Kaplan-Meier curve to show the overall survival of HNSCC patients in low INHBA expression and high INHBA expression subgroups. (I) GSEA analyzed gene characteristics between INHBA low expression subgroup and INHBA high expression subgroup, located on the right and left side, respectively. (J,K) The enrichment of INHBA was analyzed by GO and KEGG. GO, Gene Ontology; KEGG, Kyoto Encyclopedia of Genes and Genomes. *p < 0.05, **p < 0.01, ***p < 0.001, ****p < 0.0001.
Correlation of INHBA expression with prognosis and biological functions
Through analyses of the TCGA, GSE42743, and GSE75538 databases, along with in vitro qPCR verification, we found that both INHBA protein and mRNA expression levels were significantly elevated in OSCC and HNSCC. Moreover, these levels increased significantly with the progression of OSCC and HNSCC malignancy (Fig. 5A–D). Subsequently, OSCC and HNSCC samples were respectively stratified into high- and low- INHBA-expression subtypes. Survival analysis revealed a negative correlation between INHBA expression and patient survival, with the high-INHBA-expression subgroup exhibiting a poorer prognosis (Fig. 5E–H). GSEA analysis showed that epithelial-mesenchymal transition, angiogenesis, TGF-β signaling, and TNFα signaling via NF-κB pathways were enriched in samples with high INHBA expression (Fig. 5I). Additionally, GO enrichment and KEGG pathway analyses indicated that INHBA was closely associated with molecular metabolism, protein binding, and mitochondrial redox reactions in OSCC (Fig. 5J,K). Therefore, our findings suggested that increased INHBA expression may promote the invasion of OSCC and HNSCC, thus contributing to poorer patient prognosis. The underlying molecular mechanisms, however, warrant further experimental investigation.
INHBA projection and cell communication analysis in OSCC
Analysis of INHBA expression in the scRNA-seq dataset revealed that INHBA was predominantly enriched in fibroblast clusters (Fig. 6.A-C). Additionally, a positive correlation was observed between INHBA and COL1A1 expression (Fig. 6.D), indicating that high INHBA expression may drive OSCC progression and influence prognosis by mediating tumor fibrosis.
Fig. 6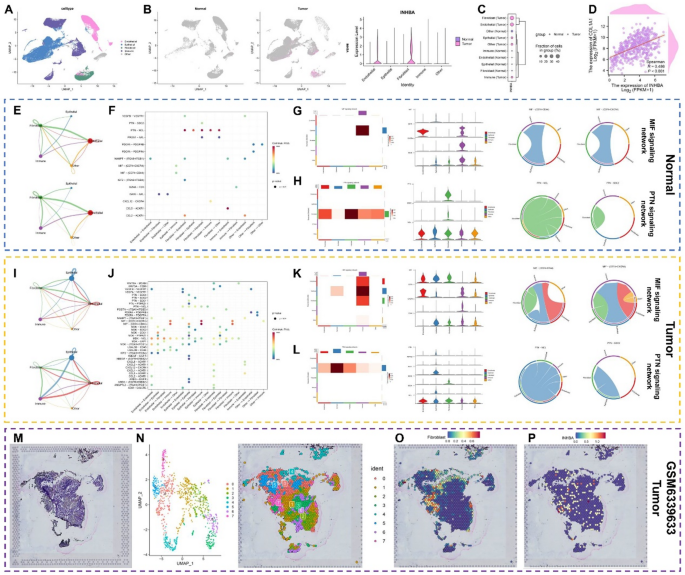
Analysis of INHBA projection and cell communication in OSCC. (A–C) The relationship between INHBA expression and different cell clusters in normal and tumor tissues. (D) Correlation analysis of COL1A1 and INHBA. (E,I) Strength and number of ligand-receptor interactions between pairs of cell populations in the normal (E) and HNSCC (I) groups based on CellChat analysis. (F,J) Bubble plot of several tumor-specific pathways among different cell clusters in normal (F) and tumor (J) tissues. (G-H) MIF and PTN signaling network shown via heatmap, violin plot, and circle plot in normal tissues. (K,L) MIF and PTN signaling network shown via heatmap, violin plot and circle plot in tumor tissues. (M-P) The spatial arrangement of INHBA expression and cell clusters via spatial transcriptomics analysis. *p < 0.05, **p < 0.01, ***p < 0.001, ****p < 0.0001.
CellChat was used to map complex intercellular communication networks. In OSCC samples, enhanced interactions were detected between fibroblasts and epithelial cells, as well as between fibroblasts and immune cells (Fig. 6E,I). Ligand-receptor interaction networks among different cell types were analyzed, showing that the PTN-NCL interaction was significantly weakened in OSCC compared to the normal group, whereas the MIF-(CD74 + CXCR4) and MIF-(CD74 + CD44) interactions were notably enhanced (Fig. 6F–H,J–L). Further analysis showed that the communication between fibroblasts and immune cells in MIF-(CD74 + CD44) in tumor group was enhanced. Using spatial transcriptome data, tissue section projections demonstrated the extensive distribution of cancer-associated fibroblasts (CAFs). Overlapping areas of INHBA and CAFs were observed, consistent with single-cell analysis results (Fig. 6M–P). These findings suggested that the intercellular communication patterns in OSCC tissues differ from those in normal cells, and INHBA overexpression may contribute to OSCC development by enhancing communication between tumor fibroblasts and immune cells.
Downstream exploration of fibroblast subsets
Cancer-associated fibroblasts (CAFs) are recognized as pivotal players in the pathogenesis and progression of OSCC. In this study, drawing on previous research41, we isolated fibroblasts from scRNA-seq data and further classified them into five subgroups: ap-Fibroblast, In-fibroblast, inCAF, myCAF and NF. (Fig. 7A,B, S3). We found that INHBA was expressed in these fibroblast clusters (especially the myCAF clusters) (Fig. 7C,D). Additionally, we observed positive correlations between the expression levels of POSTN, TAGLN, and INHBA (Fig. 7E). CellChat then analyzed intercellular communication within fibroblasts and noted that myCAF/inCAF dominated interactions with other fibroblasts in OSCC, and that this intercellular communication may be mediated mainly by MIF and POSTN regulation (Fig. 7G,H,J). MIF-(CD74CD44) and POSTN-(ITGAV+ITGB5) strongly correlated (Fig. 7K,L). Based on these results, we suggested that the overexpression of INHBA in tumor fibroblasts may regulate the functional relationship between myCAF and inCAF in OSCC, thereby promoting tumor development.
Fig. 7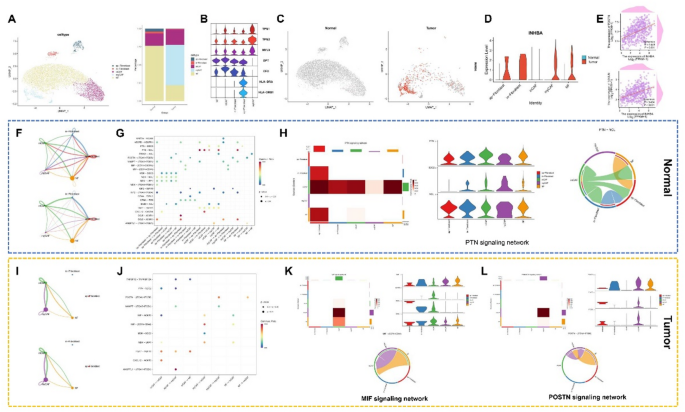
Downstream exploration of fibroblast subsets. (A) UMAP plots for fibroblast subsets in normal and tumor tissues, and bar graph of relative cell proportions. (B) Marker genes expressed in 4 major cell compartments. (C,D) The relationship of INHBA expression and different cell clusters in normal and tumor tissues. (E) Correlation analysis of POSTN and TAGLN with INHBA. (F,I) Strength and number of ligand-receptor interactions between pairs of cell populations in the normal (F) and OSCC (I) groups based on CellChat analysis. (G,J) Bubble plot of several tumor-specific pathways among different cell clusters in normal (G) and tumor (J) tissues. (H) PTN signaling network shown via heatmap, violin plot, and circle plot in normal tissues. (K-L) MIF and POSTN signaling network shown via heatmap, violin plot and circle plot in tumor tissues. *p < 0.05, **p < 0.01, ***p < 0.001, ****p < 0.0001.
Clinical transformation of INHBA in OSCC
Based on INHBA expression levels, we observed that patients with low INHBA expression exhibited longer overall survival following anti-CTLA4 and anti-PD-L1 treatments. Conversely, those with high INHBA expression showed extended progression-free survival after CAR-T therapy (Fig. 8A–C). These findings suggested that CAR-T therapy may be more efficacious in OSCC patients with elevated INHBA expression. After immunotherapy in the GSE195832 database, results showed increased INHBA expression levels, as did Cetuximab for HNSCC (Fig. 8D,E). This suggested that the resistance of Cetuximab may be related to INHBA, and we need to further find suitable drugs for OSCC patients.
Fig. 8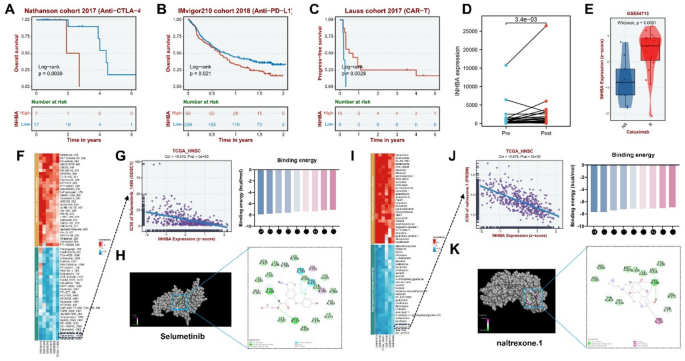
Clinical transformation of INHBA in OSCC. (A–D) Kaplan-Meier curves showing the relationship between INHBA expression and survival in the OSCC immunotherapy cohorts. (E) Relationship between INHBA expression and cetuximab treatment. (F,I) Plot of correlation analysis between INHBA expression and several drug sensitivities (IC50) in two databases: GDSC and PRISM. A positive correlation is represented in blue, indicating that increased gene expression corresponds to greater drug sensitivity, whereas red indicates the contrary. (G) Relationship between INHBA expression and selumetinib sensitivity. (J) Relationship between INHBA expression and naltrexone sensitivity. (H, K) Molecular docking structure diagram of INHBA and two drugs with the highest binding affinities. *p < 0.05, **p < 0.01, ***p < 0.001, ****p < 0.0001.
Therefore, we analyzed the GDSC and PRISM databases and predicted IC50 drug data. Drug sensitivity analysis revealed that selumetinib and naltrexone were highly sensitive inhibitors of INHBA (Fig. 8F–G,I,J). Subsequently, we conducted a molecular binding study to confirm the binding efficacy of INHBA with these two drugs. The docking results showed that the receptor-ligand binding energy of the core components of selumetinib and naltrexone was ≤ -7.0 kcal/mol, confirming the reliability of our prediction (Fig. 8H,K).
Comprehensive analysis of INHBA in pan-cancer
Pan-cellular death is intricately linked to the initiation and progression of various cancer types. Thus, we sought to determine whether INHBA, the key mitochondria-associated pan-cell death gene (MAPG) identified in this study, could serve as a predictor of poor prognosis across different malignancies. To this end, we analyzed the relative expression of INHBA in 33 cancer types and normal tissue samples from TCGA (Fig. 9A–C). Findings revealed that, compared to normal tissues, INHBA was significantly upregulated in 17 cancer types (BLCA, BRCA, CESC, CHOL, COAD, DLBC, ESCA, GBM, HNSC, KIRC, LAML, LGG, PAAD, PRAD, READ, STAD, and THCA). Conversely, INHBA was downregulated in seven cancer types (ACC, KICH, KIRP, LIHC, SKCM, UCEC, and UCS). We further explored the prognostic value of INHBA across diverse cancer types. Univariate Cox regression analysis of pan-cancer data showed that INHBA upregulation was associated with poor overall survival (OS) in 10 cancer types (ACC, BLCA, CESC, HNSC, KIRP, LAML, LUSC, MESO, PAAD, and STAD) (Fig. 9D). In eight cancer types (ACC, BLCA, BRCA, GBM, HNSC, KIRP, MESO, and PAAD), INHBA upregulation was linked to poor disease-free survival (DSS) (Fig. 9E). Additionally, in 10 cancer types (BRCA, CESC, HNSC, KIRP, LGG, LUAD, MESO, PAAD, PRAD, and UVM), INHBA upregulation correlated with a poor progression-free interval (Fig. 9F).
Fig. 9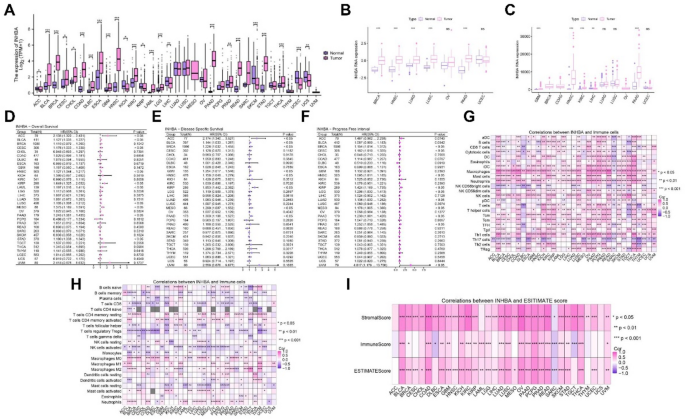
Comprehensive analysis of INHBA in pan-cancers. (A–C) INHBA expression in 33 tumor types. (D–F) Prognosis of INHBA in 33 tumors. (G,H) Analysis of immune cell infiltration in 33 tumors based on INHBA. (I) ImmuneScore, StromalScore, and ESTIMATEScore scores in 33 tumors based on INHBA. *p < 0.05, **p < 0.01, ***p < 0.001, ****p < 0.0001.
We also investigated the association between INHBA gene expression and tumor microenvironment. The results showed that INHBA expression was closely associated with the infiltration levels of macrophages, neutrophils, and Th1 cells in multiple tumors (Fig. 9G,H). Using the ESTIMATE algorithm to quantify the immune and stromal scores, we found that INHBA gene expression was significantly correlated with the stromal score in most cancer types (Fig. 9I).


