
 After A 7x Five Year Run?")
Find your next quality investment with Simply Wall St’s easy and powerful screener, trusted by over 7 million individual investors worldwide.
Investors may be wondering if e.l.f. Beauty’s share price still makes sense at current levels or if the excitement has run ahead of the underlying value.
The stock last closed at US$92.05, with a 7 day return of a 2.1% decline, a 30 day return of 8.3%, and a year to date return of 18.3%, while the 1 year return sits at 31.0% and the 3 year return at 22.4%.
These moves sit against a backdrop of ongoing investor interest in the brand and its position in the beauty space, with sentiment often shifting as the market reassesses how much growth is already reflected in the price. For long term holders, the very large 5 year return of more than 7x raises the question of whether the current valuation is still grounded in fundamentals.
At present, e.l.f. Beauty has a valuation score of 1 out of 6. Below, we look at what different valuation methods indicate about the stock and then conclude with a way of thinking about value that goes beyond any single model.
e.l.f. Beauty scores just 1/6 on our valuation checks. See what other red flags we found in the full valuation breakdown.
A Discounted Cash Flow, or DCF, model projects a company’s future cash flows and then discounts them back to today’s dollars to estimate what the business might be worth per share right now.
For e.l.f. Beauty, the model used is a 2 Stage Free Cash Flow to Equity approach, based on cash flow projections in $. The latest twelve month free cash flow is reported at about $226.6 million. Analysts provide explicit forecasts for several years, and then Simply Wall St extrapolates further free cash flow projections out to 2035 using the earlier data as a guide.
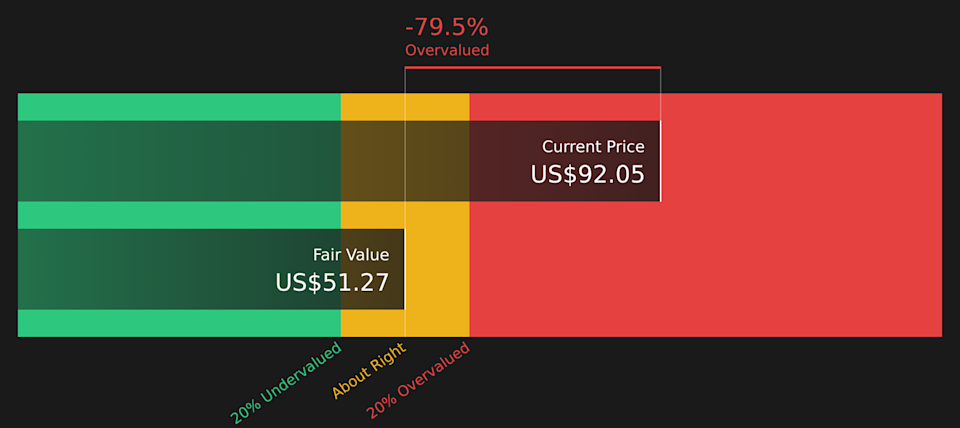
Bringing all of those projected cash flows back to today, the DCF model arrives at an estimated intrinsic value of roughly $51.51 per share. Compared with the recent share price of $92.05, this implies the shares are about 78.7% above the DCF estimate. This points to the stock trading at a premium to what this model suggests.
Result: OVERVALUED
Our Discounted Cash Flow (DCF) analysis suggests e.l.f. Beauty may be overvalued by 78.7%. Discover 46 high quality undervalued stocks or create your own screener to find better value opportunities.
 ELF Discounted Cash Flow as at Mar 2026
For profitable companies, the P/E ratio is a useful way to think about value because it links what you pay per share to the earnings that each share generates. In general, higher expected earnings growth and lower perceived risk can justify a higher P/E, while slower growth and higher risk usually call for a lower, more cautious multiple.
e.l.f. Beauty currently trades on a P/E of 52.30x. That sits above the Personal Products industry average of 22.10x and above the peer group average of 11.48x, so on simple comparisons the shares look expensive relative to many alternatives in the same space.
Simply Wall St also calculates a proprietary “Fair Ratio” for the preferred multiple. For e.l.f. Beauty, this Fair P/E is 43.05x, based on factors such as earnings growth, profit margins, industry, market cap and company specific risks. This tailored yardstick can be more informative than a broad industry or peer average because it attempts to match the multiple to the company’s own profile rather than a one size fits all group. With the current P/E of 52.30x sitting above the Fair Ratio of 43.05x, the stock screens as expensive on this metric.
Result: OVERVALUED
 NYSE:ELF P/E Ratio as at Mar 2026
P/E ratios tell one story, but what if the real opportunity lies elsewhere? Start investing in legacies, not executives. Discover our 19 top founder-led companies.
Earlier we mentioned that there is an even better way to understand valuation. On Simply Wall St you can use Narratives, where you tell the story you believe about e.l.f. Beauty, link that story to a forecast for revenue, earnings and margins, and the platform turns it into a fair value that you can compare with the current price to see whether your story suggests the stock is expensive or cheap.
A Narrative is essentially your own investment storyline backed by numbers. On the Community page you can see how different investors frame e.l.f. Beauty, from a more cautious view with a fair value of US$85.00 to more optimistic views at US$136.00 or US$152.71, each tied to specific assumptions for revenue growth, profit margins, discount rates and future P/E multiples.
Because Narratives on the platform are refreshed when new earnings, news or guidance arrive, your fair value stays linked to the latest information. This can help you decide if your buy or sell timing still matches your thesis, or if the gap between price and your fair value has closed or widened enough to reconsider your stance.
For e.l.f. Beauty, however, we will make it really easy for you with previews of two leading e.l.f. Beauty Narratives:
🐂 e.l.f. Beauty Bull Case
Fair value estimate: US$113.77 per share
Implied undervaluation vs last close: about 19.1%
Assumed annual revenue growth: 14.48%
Analysts describe ongoing market share gains supported by international expansion, strong influencer and digital marketing, and the addition of brands like Rhode.
Their models incorporate assumptions for higher revenue and profit margins over time, using a discount rate of 7.7% and a future P/E of around 33.2x.
They describe the current price as close to their average target, so the onus is on you to test whether the revenue, margin, and multiple assumptions feel realistic.
🐻 e.l.f. Beauty Bear Case
Fair value estimate: US$85.00 per share
Implied overvaluation vs last close: about 8.3%
Assumed annual revenue growth: 12.47%
Bearish analysts focus on risks tied to heavy China production exposure, higher tariffs, and rising competition that could pressure margins and the P/E investors are willing to pay.
Their framework uses revenue and earnings growth assumptions, but pairs that with a lower future multiple of about 23.9x and a discount rate of 7.6%.
They describe the current price as sitting above their fair value, which implies less room for disappointments on growth, profitability, or execution.
These two Narratives provide a range of outcomes you can stress test against your own expectations for e.l.f. Beauty, from how quickly revenue could grow to what P/E you consider sensible for the business over time.
Do you think there’s more to the story for e.l.f. Beauty? Head over to our Community to see what others are saying!
NYSE:ELF 1-Year Stock Price Chart
This article by Simply Wall St is general in nature. We provide commentary based on historical data and analyst forecasts only using an unbiased methodology and our articles are not intended to be financial advice. It does not constitute a recommendation to buy or sell any stock, and does not take account of your objectives, or your financial situation. We aim to bring you long-term focused analysis driven by fundamental data. Note that our analysis may not factor in the latest price-sensitive company announcements or qualitative material. Simply Wall St has no position in any stocks mentioned.
Companies discussed in this article include ELF.
Have feedback on this article? Concerned about the content? Get in touch with us directly. Alternatively, email editorial-team@simplywallst.com


