

Hydrogel coatings maximizing cell migration enhance cell sampling by MN patches
We previously developed minimally invasive MN patches capable of sampling both ISF and cells from skin. These patches are fabricated by melt-moulding of polylactide, a biodegradable polymer similar to that used in resorbable sutures35,36, to form an array of conical MN projections 550 μm long and 250 μm wide at the base, extending from a solid polymer backing. For small-animal studies, we employed patches 2 cm2 in area containing 400 MN projections, which are readily applied to the flanks of mice (Fig. 1a). These designs were based on MN dimensions shown to be effective for epidermal sampling in humans and rodents37: the human epidermis is typically <150 μm thick, while the dermis extends at least 600 μm, allowing our 550 μm microneedles to reliably reach the dermis without contacting deeper structures38,39. Similarly, in mice, the dermis ranges from ~600–700 μm in thickness40, and microneedles in the 500–700 μm range have been shown to be optimal for skin immune cell recovery41,42,43. Thus, our selected microneedle dimensions enable consistent penetration into the upper dermis in both species while minimizing tissue damage. A coating of sucrose and ionically crosslinked alginate, a US Food and Drug Administration (FDA) generally-regarded-as-safe biocompatible polysaccharide that swells strongly in water44,45, is cast over the MN projections to serve as the cell/fluid sampling layer. Sampling is carried out by applying the patch to the skin with mild pressure, which causes mechanical penetration of the stratum corneum and entry of MN projections into the epidermis (Fig. 1b(i)). Sucrose in the cell sampling coating (included to augment the mechanical strength of the sampling layer during skin insertion) rapidly dissolves and the alginate layer swells, absorbing ISF and enabling migration of cells into the gel coating (Fig. 1b(ii)). The coating is then dissolved with ethylenediaminetetraacetic acid (EDTA) to recover captured cells and fluid for analysis (Fig. 1b(iii)).
Fig. 1: Identifying properties of hydrogel-coated microneedles for optimized cell sampling.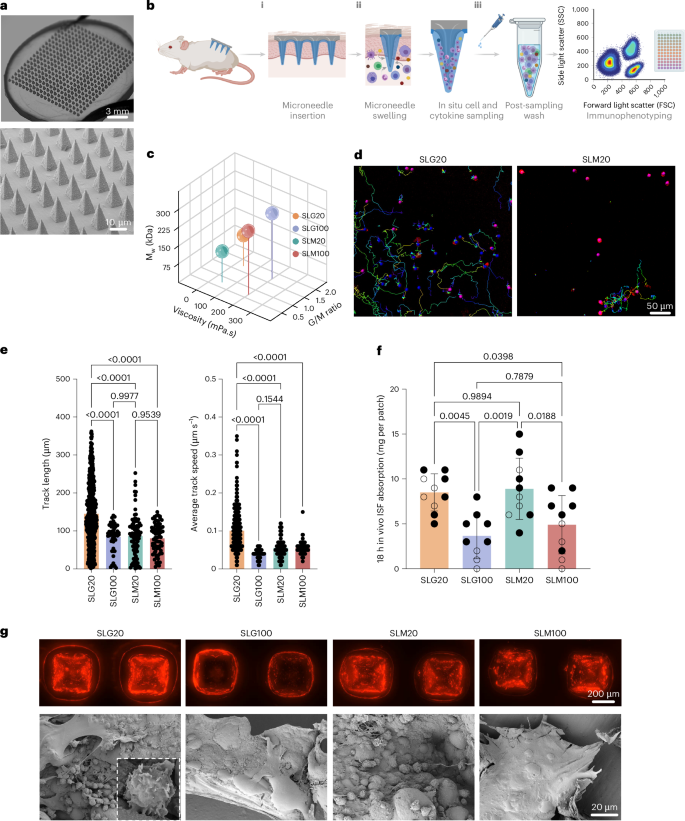
a, Photographs and scanning electron micrographs of the hydrogel-coated MN patch. b, Schematic view of the cell and interstitial fluid sampling process with MN array applied to the skin. c, Molecular weight, G/M ratio and viscosity of alginates tested as MN coatings. d, Still frames from time-lapse microscopy of activated T cells incubated in SLG20 and SLM20 hydrogels in vitro showing tracked individual cell paths as coloured lines. e, Quantification of T cell motility length and average track speed inside different hydrogels (n = 3 hydrogels per cell per group). f, Comparison of interstitial fluid sampling capacity between patches coated with different alginates (n = 10 animals per group). g, Optical and scanning electron micrographs of the patches after 18 h of in vivo sampling on the skin of OVA-immunized mice and sampled following the scheme of Fig. 2b (TRM recall), showing the retention of the alginate layer (labelled with Alexa647 for visualization) and collected cells on the patch (inset: high-magnification view of lymphocytes captured by the MN patch). Data shown are mean ± s.e.m. P values were determined using one-way ANOVA followed by Tukey’s multiple comparisons test (e,f). Panel created in BioRender: b, Jalili, S. https://biorender.com/b3buou9 (2026).
Although our previously reported prototype patch design26 was functional, we first sought to test whether the composition of the sampling layer could be further optimized to maximize cell recovery from the skin. The sampling layer is formed by dropcasting an alginate and sucrose solution over the MN patch, drying to a solid coating, then crosslinking the alginate with calcium chloride solution, followed by a second drying step to achieve a uniform alginate coating over the MN projections (Extended Data Fig. 1a,b). We first tested the influence of the alginate’s molecular weight, guluronic to mannuronic acid ratio (G/M ratio), and viscosity on in vitro and in vivo fluid absorption, as well as cellular interactions with the hydrogel layer. Four distinct ultra-pure alginates, SLG20, SLG100, SLM20 and SLM100, each with varied physical properties, were tested (Fig. 1c). Modifying the G/M ratio and molecular weight of alginate has been demonstrated to alter its physicomechanical properties, including porosity and stiffness44,46. In vitro bulk swelling of sampling layers prepared with each of these alginates was essentially identical (Extended Data Fig. 1c). However, we hypothesized that alginate properties could also affect the ability of cells to migrate within the sampling layer gel, and thereby impact cell collection in vivo. To test this, we encapsulated primary mouse T cells in gels prepared from each of the alginates (crosslinked under the same conditions used for sampling layer formation) and tracked cell migration over time by time-lapse microscopy. Strikingly, we observed substantially higher motility and cell migration within SLG20 gels compared with the other alginates, with ~2-fold greater mean track lengths and ~2.5-fold greater mean cell speeds than observed for lymphocytes in the other gels (Fig. 1d,e).
To assess the behaviour of these different alginate coatings in vivo, we applied patches to the skin of C57Bl/6 mice for 18 h. In contrast to the in vitro swelling measurements, in vivo patch sampling revealed distinct quantities of ISF recovered by patches bearing sampling layers prepared with different alginates; sampling layers prepared with SLG20 or SLM20 recovered approximately twice the interstitial fluid of patches prepared with the other two alginates (Fig. 1f). Optical and scanning electron microscopy (SEM) imaging revealed distinct differences in the microneedle patches after skin application. Patches coated with SLG100 or SLM100 alginate showed numerous microneedles that had lost their alginate coating following application to skin, resulting in fewer sampled cells accumulating on them (Fig. 1g). In contrast, patches coated with SLG20 retained their alginate layer on all microneedle projections and many more cells could be observed associated with the hydrogel coating (Fig. 1g). We thus focused further studies on SLG20 as the sampling layer polymer.
We next assessed effects of crosslinking density, sucrose content and coating. Crosslinking with less than 20 mM CaCl2 produced fragile gels, while higher calcium concentrations reduced swelling, which would reduce ISF recovery (Extended Data Fig. 1d). Sucrose concentration modestly affected fluid uptake, and thicker coatings increased swelling but not cell yield, probably due to limitations in migration depth of cells into the patch in the application time (Extended Data Fig. 1e,f). Altogether, these studies led us to focus on cell/fluid sampling patches prepared with sampling layers cast from 0.6 wt% SLG20 alginate/2.5 wt% sucrose solutions, ~10 µm thick in their final dried state.
Stimulation of local tissue-resident memory T cells augments skin patch MN cell sampling
In the absence of specific stimuli, MN patches applied to the skin recover few cells and provide little insight into vaccine- or disease-specific immune responses. We hypothesized that the efficiency of sampling antigen-specific lymphocyte populations could be amplified by inducing a population of tissue-resident memory T cells (TRM) in the skin, which would serve to actively recruit immune cells from the circulation before patch sampling. This concept is schematically outlined in Fig. 2a: To establish a TRM population, animals with an antigen-specific immune population of interest, for example, animals that have been vaccinated with a selected antigen(Fig. 2a(i)) are inoculated intradermally (i.d.) with a small dose of the antigen combined with an adjuvant to recruit and establish antigen-specific tissue-resident memory T cells at a selected site on the skin (Fig. 2a(ii)). Once established, this antigen-specific TRM population is recalled by i.d. injection of a small dose of the antigen and adjuvant at the same site, which triggers the ‘alarm’ function of TRM, leading to rapid production of chemokines that draw a large population of antigen-specific cells to the local skin site30,47,48,49 (Fig. 2a(iii)). MN patch sampling at the site is then used to non-invasively recover and analyse the makeup of the antigen-specific immune response (Fig. 2a(iv)).
Fig. 2: Enhancing MN cell sampling via tissue-resident T cell restimulation.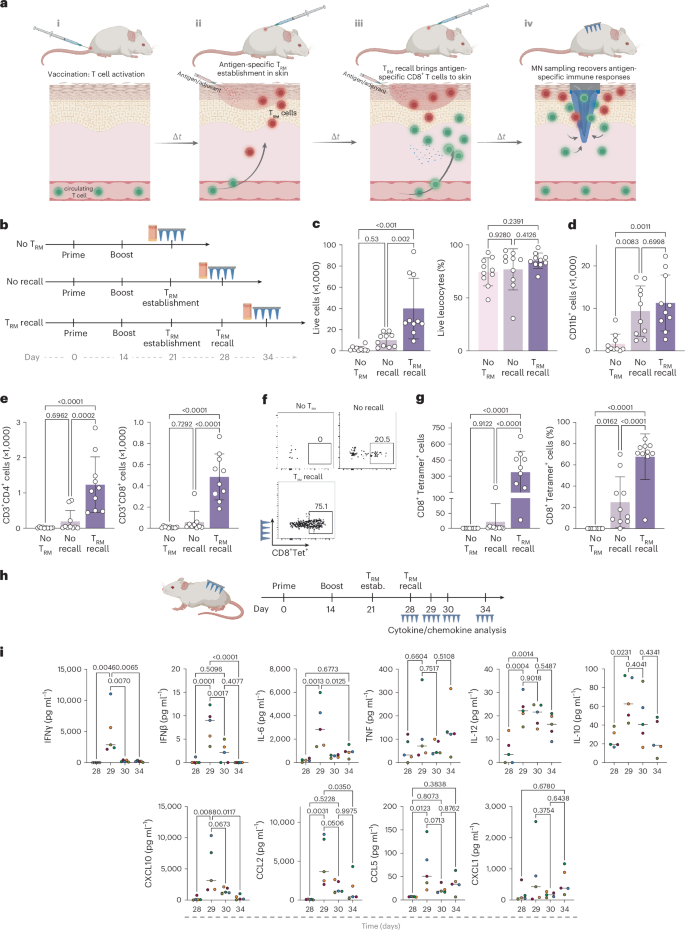
a, Schematic view of TRM establishment, recall and recruitment of antigen-specific tissue-resident memory T cells for MN patch sampling at a selected site on the skin. b, Study design for establishing TRM populations in the skin and subsequent TRM recall in mice immunized with OVA protein (10 μg per dose) and Lipo-CpG (1.24 nmol per dose). Blood and MN samples were collected 7 days after TRM recall. c–e, Enumeration of recovered total live leucocytes, CD3+ T cells, TRM cells and antigen-specific CD8+ T cells recovered by MN patches under different sampling regimens. f, Representative flow cytometry plots showing SIINFEKL peptide–MHC tetramer staining to identify antigen-specific CD8+ T cells collected using MN patches 7 days after TRM recall. g, Enumeration of recovered antigen-specific CD8+ T cells in the MN patches at TRM establishment and recall steps in comparison with No TRM. h, study design for longitudinal cytokine sampling post TRM recall step. i, Expression of inflammatory cytokines and chemokines induced in the skin measured using multiplexed ELISA analysis of interstitial fluid samples recovered by MN patches following TRM recall. n = 10 animals per group (a–g) and n = 5 animals per group (i). Data shown are mean ± s.e.m. P values were determined using one-way ANOVA followed by Tukey’s multiple comparisons test (c–e,g,i). Panel created in BioRender: a, Jalili, S. https://biorender.com/awru57q (2026); panel elements created with BioRender: h, Jalili, S. https://biorender.com/8arfbyn (2026).
We first tested whether TRM stimulation would facilitate enhanced MN sampling of antigen-specific T cells in a vaccination model. Mice were primed and boosted with ovalbumin (OVA) + CpG adjuvant, then intradermally inoculated with OVA + CpG to establish TRMs at a defined skin site. One week later, a recall dose of OVA + CpG was administered at the same site, and local immune infiltration was analysed 6 days later (‘TRM recall’ in Fig. 2b). Controls included skin with TRM establishment but no recall (‘no recall’) and skin sites without TRM establishment or recall (Fig. 2b, ‘no TRM’). TRM recall increased total live and CD11b+ myeloid cells recruited to the site by ~3-fold compared to controls (Extended Data Fig. 2a,b). More strikingly, TRM induction led to 12-fold and 5-fold increases in CD4+ and CD8+ T cells, respectively, and a 35-fold increase in OVA-specific CD8+ T cells in the skin relative to the ‘no TRM’ group (Extended Data Fig. 2c,d). This recruitment depended on TRM restimulation as T cell infiltration was much lower in the ‘no recall’ condition (Extended Data Fig. 2c,d), and was probably mediated by recruitment of T cells from the circulation, as only a minority of recovered cells expressed the marker of tissue residency, CD103 (Extended Data Fig. 2e,f). Importantly, both antigen and adjuvant were required for robust TRM establishment, as neither alone induced significant T cell accumulation (Extended Data Fig. 2g).
Next, we tested cell recovery using MN patches under the same 3 treatment conditions (Fig. 2b). In the absence of TRM, few live cells were recovered from the MN patches (Fig. 2c). When TRMs were induced in the skin, a trend towards increased cell recovery at the sampled skin site was observed, but this did not reach statistical significance. However, live cell recovery increased 20-fold over the ‘no TRM’ case when the TRM population was recalled with antigen/adjuvant before MN sampling (Fig. 2c). In addition to absolute numbers, we also quantified the percentage of live leucocytes recovered (Fig. 2c); MN sampling enabled cell recovery with high viability. When we examined the cell types recovered by MN patches, we found that myeloid cell recovery was increased ~5-fold for both the TRM recall and no-recall groups vs ‘no TRM’ sampling (Fig. 2d). By contrast, TRM recall sampling led to 6.5-fold and 8-fold greater CD4+ and CD8+ T cells recovered, respectively, compared with the no-recall sampling conditions (Fig. 2e). This pattern of enhanced T cell recovery by sampling TRM-stimulated skin was even more pronounced when we examined the recovery of antigen-specific OVA tetramer+ T cells recovered by the MN patches, with TRM recall leading to 18-fold greater numbers of antigen-specific cells recovered compared with the no-recall condition (Fig. 2f,g). Notably, the majority of CD8+ T cells recovered in the patches using TRM recall were antigen specific (Fig. 2g). In addition to T cells and myeloid cells, we also observed a substantial CD11b−CD3− population among the recovered cells. This non-myeloid, non-T cell fraction probably includes other immune populations such as B cells, natural killer (NK) cells and innate lymphoid cells (ILCs) (Extended Data Fig. 2h,i). Furthermore, ~30% of the recovered cells were CD45−, probably non-immune skin-resident cells such as fibroblasts or keratinocytes (Extended Data Fig. 2h,i). These subsets were not further characterized here, as our primary emphasis was on T cells and myeloid cells. Consistent with our initial patch optimization findings, when MN patches with different alginate coatings were employed to sample cells from OVA-immunized mice skin, SLG20 demonstrated superior performance, collecting more live CD45+ cells, myeloid cells, CD4+ and CD8+ T cells, as well as antigen-specific OVA tetramer+ TRM cells (Extended Data Fig. 3a).
Two important parameters in this sampling approach are (1) the interval between TRM recall and patch application and (2) the duration of patch application. We applied patches in the above sampling experiments 6 days after TRM recall to allow time for robust T cell recruitment to the site from circulation. To determine whether this recruitment period was important, we compared T cell recovery after applying patches at 1 day or 6 days after TRM recall. Total and antigen-specific T cell recovery was much lower when patches were applied at 1 day post TRM recall (Extended Data Fig. 3b). When different durations of MN patch application were compared, we observed that the number of live lymphocytes and T cells recovered peaked with an 18-h duration of patch application to the skin (Extended Data Fig. 3c). We thus used SLG20 MN patches, with patches applied for 18 h at 6 days post TRM recall, for all subsequent cell sampling studies.
To gain insight into the signalling milieu established following TRM recall, we analysed a panel of inflammatory cytokines and chemokines induced in the skin using multiplexed enzyme-linked immunosorbent assay (ELISA) analysis of interstitial fluid samples recovered by MN patches applied to treated skin at different time points following TRM recall (Fig. 2h). TRM recall induced a coordinated response consisting of induction of an early burst of IFNγ, IFNβ and IL-6 at 24 h, which rapidly returned to baseline (Fig. 2i). Other chemokines such as CCL5 and CXCL1 showed a trend towards more sustained expression following recall. Thus, ‘TRM recall’ was accompanied by rapid induction of inflammatory cytokine/chemokine induction in the skin and greatly augmented MN sampling of antigen-specific T cells.
Finally, to confirm that the antigen/adjuvant administration used to induce and recall TRMs does not itself affect the systemic immune response, we assayed circulating antigen-specific T cell levels following administration of different doses of OVA and adjuvant during the TRM establishment/recall steps. We intentionally administered the TRM recall dose with a 3-week gap after TRM establishment to observe whether the intradermal TRM recall injection would lead to a sudden increase in antigen-specific cells in the blood (Extended Data Fig. 4a). We observed that the number of antigen-specific CD8+ T cells accumulating in the local site in response to TRM recall treatment was dependent on the dose of antigen inoculated in the skin (Extended Data Fig. 4b,c) and was amplified only following the final TRM recall inoculation (Extended Data Fig. 4d); however, no significant increase was observed in antigen-specific T cells in the blood following the TRM establishment or TRM recall intradermal injections (Extended Data Fig. 4e).
To directly address whether immune cell capture by MN patches can occur at later time points after sensitization alone, without TRM recall, we compared multiple experimental groups with and without recall stimulation. Our results demonstrate that waiting longer than 1 week after TRM establishment to carry out MN sampling, without TRM recall, did not yield increases in the number of antigen-specific CD8+tetramer+ T cells in the skin, even 3 weeks after TRM establishment (Supplementary Fig. 1). In contrast, groups that underwent both TRM establishment and recall showed a robust accumulation of antigen-specific T cells at the skin site. These findings indicate that TRM recall is mechanistically necessary to ‘alarm’ the skin and recruit circulating antigen-specific T cells, and that sensitization alone, even over an extended time, is insufficient to recruit additional immune cells to the tissue.
T cells recovered from TRM-stimulated skin reflect the circulating antigen-specific immune response
We hypothesized that TRM recall would lead to recruitment of antigen-specific T cells from the circulation, and thus provide a window into the systemic T cell response. However, stimulated T cells can also proliferate locally50, hence it was important to evaluate the role of systemic T cell recruitment vs local TRM expansion on the makeup of cells recovered by patch sampling. To monitor the migration of antigen-specific T cells to the TRM recall site, we employed photoconvertible KikGR mice51 to distinguish sampled cells that were recruited from the blood vs tissue-resident cells (Fig. 3a). Cells in these mice express the photoreactive KikGR protein in their cytoplasm, which exhibits green fluorescence unless photoactivated by UV light, whereupon a portion of the protein photoconverts to stable red fluorescence (Fig. 3b). To employ this tracer for tracking cell recruitment in the skin, OVA-vaccinated mice were inoculated with OVA + CpG adjuvant in the skin to establish TRM, and 1 week later, the sampling site was exposed to UV light to photoconvert skin-resident cells (Fig. 3a). Subsequently, TRM were recalled by inoculation of OVA and CpG adjuvant at the same site. Analysis of the skin immediately after photoconversion (0 h) confirmed the near-complete (94%) conversion of these cells from the default green fluorescence of the KikGR protein (‘KikGR Green+’) to the altered red fluorescence profile (‘KikGR Red+Green+’, Fig. 3c). We next vaccinated mice, established TRM by i.d. antigen/adjuvant inoculation (or not), photoconverted the TRM site 1 day before TRM recall on day 28, and sampled the infiltrated cells into the photoconverted area on day 34 via MN patches (Fig. 3a). When we analysed the KikGR reporter expression of recovered cells (Fig. 3d,e), we found that in the ‘no TRM’ case, the majority of cells sampled, including myeloid cells, CD4+ T cells and CD8+ T cells, were KikGR red+green+ double positive, indicating that they were resident in the skin at the time of photoconversion and that very few recovered cells came from the circulation (Fig. 3e). By contrast, the vast majority of cells recovered by TRM recall sampling (including antigen-specific CD8+ T cells) were KikGR green single-positive (Fig. 3d,e). This indicates that either they were recruited from the circulation or they had proliferated extensively since the photoconversion timepoint.
Fig. 3: TRM recall leads to recruitment of antigen-specific T cells to the skin from circulation for recovery by MN patches.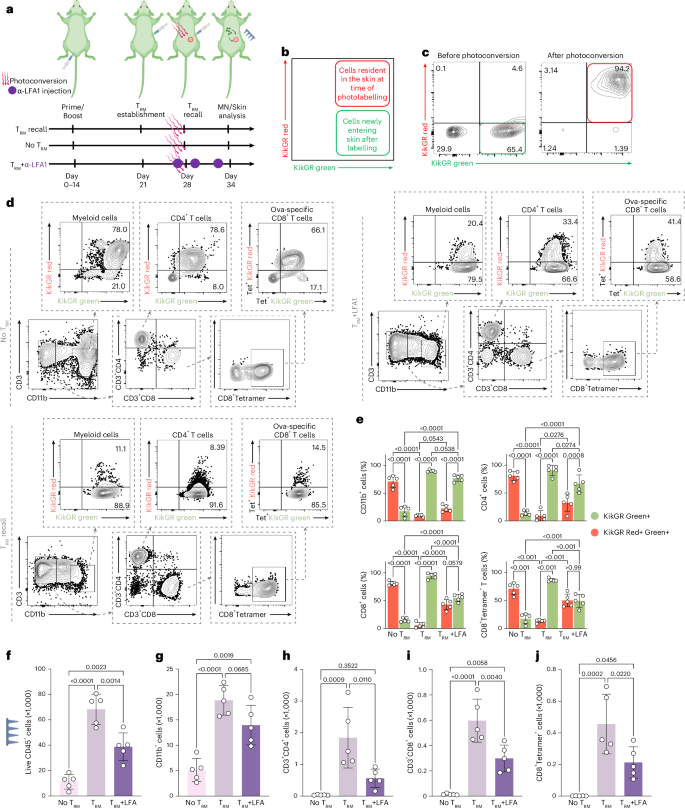
a, Schematic representation of temporal labelling of the skin of the C57BL/6 KikGR mice, photoconverted immediately before the TRM recall dose (day 28) by violet light exposure on the skin site. b,c, Representative flow cytometry plots showing KikGR red and green gene expression in skin before and immediately after photoconversion. d, Representative flow cytometry plots showing KikGR red and green expression by skin-infiltrating myeloid cells, CD3, CD4, CD8 and antigen-specific T cells on Day 34. e, Quantitation of frequencies of KikGR red+green+ and green-only+ cells by subtype, recovered from MN patch sampling following the timeline in a. f–j, Enumeration of recovered live leucocytes (f), myeloid cells (g), CD4+ T cells (h), CD8+ T cells (i) and antigen-specific CD8+ T cells (j) 7 days after TRM recall dose. n = 5 animals per group (all panels). Data shown are mean ± s.e.m. P values were determined using two-way ANOVA (e) and one-way ANOVA (f–j) followed by Tukey’s multiple comparisons test. Panel elements created in BioRender: a, Jalili, S. https://biorender.com/oz2aoky (2026).
To distinguish these possibilities, we carried out sampling under a third condition, where we restimulated TRM in the skin in the presence of systemically administered blocking antibody against Lymphocyte function-associated antigen-1 (LFA-1), as this receptor is important for the homing of T cells from the blood to inflammatory sites52,53,54 (Fig. 3a). LFA-1 blockade reduced the total live cells recovered by patch sampling of TRM-stimulated skin by ~2-fold (Fig. 3f). While the recovery of myeloid cells showed a slight, non-significant reduction (Fig. 3g), LFA-1 blockade significantly reduced CD4+ and CD8+ T cell recovery by 3-fold and 4-fold, respectively, and decreased OVA-specific CD8+ T cell recovery by 2.5-fold, (Fig. 3h–j). Further, recovered CD8+ T cells and antigen-specific CD8+ T cells were ~50/50 KikGR red+green+ vs KikGR green+ (Fig. 3e). These data suggest that at least ~50% of the total antigen-specific T cells recovered from TRM recall sampling was derived from the circulation, which is a conservative estimate because some proportion of T cell trafficking into inflamed tissues is LFA-1 independent. These data collectively suggest that antigen-specific T cells recovered by TRM-recall patch sampling represent both local tissue-resident cells and cells recruited from the circulating blood pool.
Unveiling TRM-driven virus-specific T cell responses with sampling MNs
While TRM recall was very effective for recovering T cells primed against OVA, this model antigen is highly immunogenic55. We thus next sought to test whether TRM recall-based MN sampling could enhance the detection and recovery of antigen-specific T cells primed against a bona fide viral antigen. To this end, we synthesized nucleoside-modified mRNA encoding a set of 5 Simian immunodeficiency virus (SIV) T cell epitopes as a model vaccine. This vaccine construct was designed to carry T cell epitopes presented by macaque MHC alleles, but one of the peptides in the mRNA, an epitope termed CL9, can also be presented by mouse class I molecules. A single intramuscular (i.m.) vaccination with lipid nanoparticles carrying this SIV mRNA construct elicited systemic T cell responses recognizing CL9 at a frequency of ~0.06% among all cells, which could be detected in the spleen by sensitive IFNγ ELISPOT assays on day 21 (Fig. 4a). To evaluate microneedle sampling of this response, TRM cells were established 3 weeks post mRNA vaccination via i.d. challenge with CL9 peptide and CpG adjuvant, TRMs were recalled by i.d. re-administration of CL9 + CpG at day 28, and cells were sampled with MN patches at day 34 (Fig. 4b, ‘TRM recall’). We compared TRM recall sampling to a group that only received i.d. peptide/CpG challenge at day 28 post vaccination (Fig. 4b, ‘TRM, No recall’). This control condition was intended to establish TRM and provide the same inflammatory stimulus to the skin just before MN patch sampling as done in the ‘TRM recall’ group (but without recall stimulation), to account for non-specific cell recruitment effects of the peptide/adjuvant injection. Skin biopsies at day 34 revealed that the TRM establishment enriched the presence of CD8+CD69+ and CD8+CD103+ TRM cells (Fig. 4c,d). However, following the TRM recall, we observed an increased number of CD69−CD103− cells recruited from the circulation to the site (Fig. 4d).
Fig. 4: TRM-enabled MN patch sampling of virus-specific T cells primed by mRNA vaccination.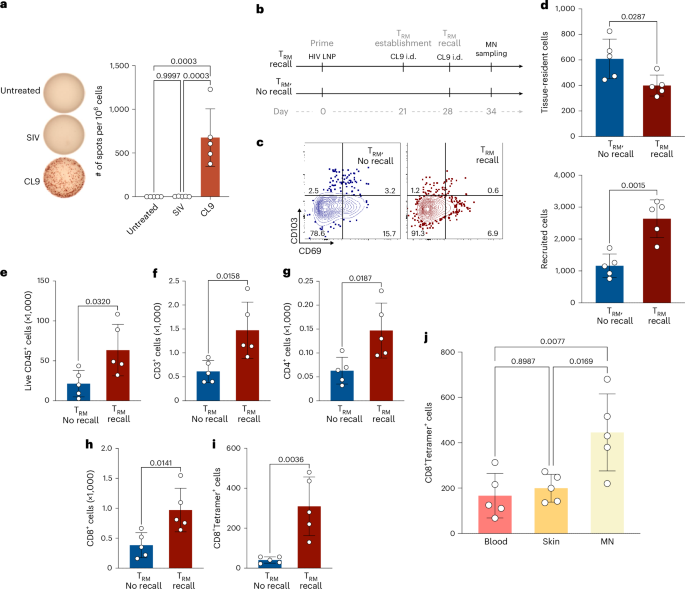
a, ELISPOT analysis of antigen-specific IFNγ-producing T cells from spleens of mice immunized with mRNA encoding SIV epitopes on day 21 post immunization (n = 5 animals per group). b, Study timeline comparing MN patch sampling under TRM recall vs ‘TRM, no recall’ conditions. c, Representative flow cytometry plots showing expression of tissue-resident phenotypic markers for cells recovered from MN patches 7 days after TRM establishment. d, Enumeration of tissue-resident (CD103+CD69+, CD103+CD69−, CD103−CD69+) or non-tissue-resident recruited (CD103−CD69−) CD8+ T cells recovered from MN patches with or without TRM recall stimulation. e–i, Quantitation of total live leucocytes (e), total T cells (f), CD4+ T cells (g), CD8+ T cells (h) and antigen-specific CD8+ T cells (i) recovered under recall or no-recall conditions. j, Quantitative comparison of antigen-specific CD8+ T cells recovered via blood draw (100 μl blood draw), skin biopsy (6 mm punch biopsy) or MN patches. Each data point represents an individual mouse. n = 5 animals per group (all panels). Data shown are mean ± s.e.m. P values were determined using unpaired two-tailed Student’s t-test (d–i) and one-way ANOVA followed by Tukey’s multiple comparisons test (j).
MN sampling of animals from these two groups revealed that TRM recall increased the recovery of total live cells, CD3+ T cells, CD4+ T cells and CD8+ T cells (Fig. 4e–h). Most strikingly, CL9 tetramer+CD8+ T cell recovery was increased 7.5-fold in the TRM recall group vs the TRM no-recall case (Fig. 4i). Comparing to a standard mouse blood draw and standard clinical skin punch biopsy (6 mm)56,57, patch sampling with TRM recall enabled >2-fold greater recovery of live antigen-specific T cells (Fig. 4j). In this analysis, we compared 2 cm² MN patches applied to murine flanks vs a 6-mm punch biopsy, which is the standard size in clinical practice. As expected, when normalized to skin area sampled, the punch biopsy, where the entire tissue is collected, recovered more cells per unit area than the patches (Extended Data Fig. 4f). While larger or multiple punch biopsies could theoretically yield greater cell numbers, these procedures are substantially more invasive, less acceptable to patients and poorly suited for longitudinal sampling. In summary, in response to bona fide viral antigen vaccination, TRM recall sampling with MN patches allows for greater recovery of live antigen-specific T cells than traditional blood sampling, and unlike blood sampling, allows recovery of both circulating and tissue-resident T cells.
Tracking TRM cells and cytokines in human allergic contact dermatitis
The studies above demonstrate a strategy of inducing antigen-specific TRM populations at selected skin sites for sensitive sampling of rare circulating T cells. A complementary approach is to leverage pre-existing disease-induced TRMs to recruit antigen-specific T cells locally for MN patch sampling, a strategy directly compatible with current dermatologic clinical practices. For human skin sampling, we fabricated square patches with a larger surface area of 4 cm2, bearing 400 microneedle projections attached to an adhesive backing for stable skin contact (Fig. 5a). Under Institutional Review Board (IRB)-approved protocols, we tested patch application across male and female volunteers of varying ages and skin tones, with wear times from 20 min to 18 h (Fig. 5a–c). Patches were well tolerated, causing only mild redness that resolved within an hour and no bleeding, swelling or adverse reactions (Fig. 5a).
Fig. 5: Cell and cytokine sampling in human patient with allergic contact dermatitis.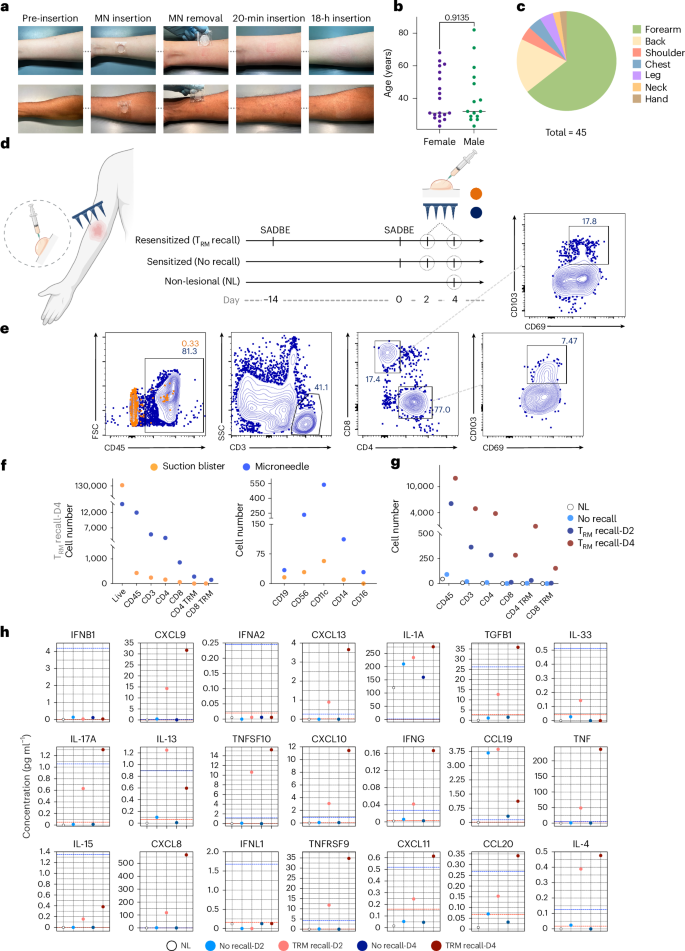
a, Representative photographs of pre- and post-MN patch application on the forearm of human volunteers. b,c. Tolerability of MN sampling was assessed on a cohort of volunteers (n = 45). Shown is the breakdown of volunteer gender and age (b) and skin areas tested (c). d, Human patient (n = 1) undergoes SADBE-induced allergic contact dermatitis with sites previously exposed (14 days before re-exposure) to SADBE. Suction blister and MN samples were collected at 2 and 4 days after SADBE treatment. A non-SADBE exposed site was selected as non-lesional skin. e, Representative flow cytometry plots showing expression of immune cell markers in ISF collected from MN patches and suction blisters. f, Enumeration of recovered total live, CD45, CD3, CD4, CD8, CD4+ TRM and CD8+ T cells as recovered by MN patches or suction blister sampling on day 4 of the ‘TRM recall’ condition. g, Comparison of cell yields from MN patches applied at 2 vs 4 days post TRM recall, alongside non-lesional skin and no-recall control groups. h, Olink proteomics data showing temporal changes in skin-associated proteins collected via MN patches. Panel elements created with BioRender: d, Jalili, S. https://biorender.com/ca1wx1s (2026).
Tissue-resident memory T cells play an important role in skin allergy, accumulating during initial allergen sensitization and driving inflammation upon re-exposure58,59,60,61. In a proof-of-concept human study, we applied MN patches following sensitization with the potent contact allergen squaric acid dibutyl ester (SADBE), which is absent in the natural environment and has been safely used in the clinic as an allergen and immunotherapeutic agent62,63. This initial exposure represents a ‘no recall’ condition, as there is no chance of previous exposure, and SADBE is safe for such studies due to the minimal risk of accidental re-exposure in the future. We then compared the no-recall case to cell recovery after a TRM recall response, induced by re-exposing the same subject to SADBE 2 weeks later. As an addition control, cell sampling was carried out on a distal non-allergen-exposed skin site (non-lesional, Fig. 5d). We also compared MN sampling to suction blister sampling64 at 2 and 4 days post resensitization to examine recall kinetics. Flow cytometry was used to identify recruited CD3+ T cells and assess markers of tissue-resident cells (CD69, CD103) as well as B cells and various innate immune cell populations (Fig. 5e and Supplementary Fig. 2a,b). While suction blister sampling recovered a larger number of live cells, almost none of these were CD45+ immune cells (probably, they are keratinocytes; Fig. 5f and Supplementary Fig. 2c). By contrast, MN patches captured primarily immune cells: CD4+, CD8+, NK, dendritic cells and monocytes (Fig. 5e,f). Strikingly, effective recovery of T cells required resensitization and increased markedly from day 2 to day 4 post recall (Fig. 5g). Although suction blistering yielded slightly higher viability, MN patches captured a greater fraction of CD45+ immune cells (Supplementary Fig. 2c).
Olink proteomic analysis of ISF from MN patches was used to track longitudinal immune responses, revealing that TRM recall was associated with an increase in cytokines linked to T cells in homing and activation (CXCL8, CXCL9, CXCL10, CXCL11, CXCL13, IFNγ, IL-17a, IL-13, IL-4, IL-15, TNF; Fig. 5h). Interestingly, MN patch protein profiles correlated well with those obtained via suction blistering (Supplementary Fig. 2d). However, blistering carries several drawbacks such as long procedure times, pain, hyperpigmentation, keratinocyte contamination and limited suitability for sensitive populations. Furthermore, the negative pressure and elevated temperature used in suction blistering can cause keratinocyte dissociation, potentially affecting the accuracy of results by introducing high numbers of non-immune cells65,66,67. MN patch sampling not only overcomes these limitations but also enables live cell recovery, enabling deeper insights into immune reactions occurring in the skin.


