

Demographic, laboratory, and oxygen therapy characteristics of the patients
A total of 151 patients younger than 24 months were included in the study, divided into mild (n = 40), moderate (n = 40), severe (n = 31), and control (n = 40) groups. Mean age (11.4–14.4 months, p = 0.22), weight (p = 0.20), and sex distribution (p = 0.12) did not differ significantly between groups. Laboratory findings showed that pH was lowest in the severe group, significantly different from the mild (p < 0.001) and moderate (p = 0.01) groups. White blood cell counts were highest in the severe group compared to the mild group (p = 0.008), while platelet counts were significantly elevated in the severe group compared to the mild (p = 0.004) and moderate (p = 0.006) groups. Neutrophil counts were also higher in the severe group compared to the mild group (p = 0.005), and moderate cases had higher neutrophil counts compared to the mild group (p = 0.04). No significant differences were found in lactate, base deficit, lymphocyte count, eosinophil count, or C-reactive protein (CRP) levels among the groups (p > 0.05 for all).
Oxygen therapy requirements varied: 70% of mild cases received mask oxygen, and 30% were managed on room air, while 70% of moderate cases required high-flow oxygen and 30% mask oxygen. In the severe group, 48.4% received high-flow oxygen and 51.6% required intubation and mechanical ventilation. These data are presented in Table 1.
Table 1 Demographic, laboratory, and oxygen therapy characteristics of patients across bronchiolitis severity groupsLevels of CD4+ and CD4+FOXP3+ T cells in bronchiolitis groups
Absolute number (#) and frequency (%) of peripheral blood CD4⁺ and CD4⁺FOXP3⁺ T (Treg) cells were analyzed by flow cytometry in bronchiolitis severity groups and healthy controls. The gating strategy is shown in Fig. 1a. Significant differences were observed among the groups for both CD4⁺ T and Treg cells (p < 0.001, Fig. 1).
Fig. 1: Altered levels of CD4+ and CD4+FOXP3+ (Treg) T cells in the peripheral blood across bronchiolitis severity groups.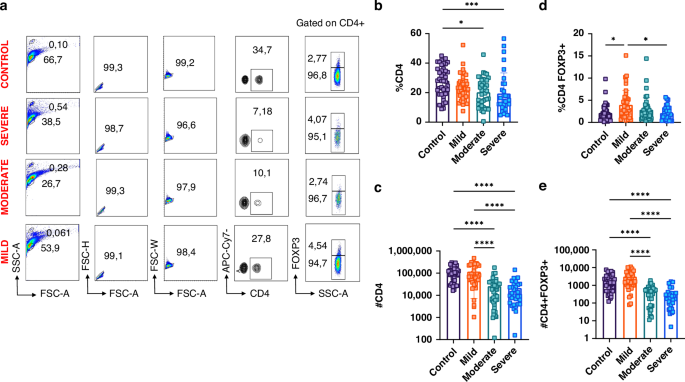
a Representative flow cytometry plots showing the gating strategy for lymphocyte and CD4⁺FOXP3⁺ T cell identification: lymphocytes were gated using SSC-A versus FSC-A, followed by gating on CD4⁺ cells and FOXP3 expression analysis. b Percentages of CD4⁺ T cells. c Absolute numbers of CD4⁺ T cells. d Percentages of CD4⁺FOXP3⁺ T cells. e Absolute numbers of CD4⁺FOXP3⁺ T cells. Statistical analysis was conducted for 151 children (40 control, 40 mild, 40 moderate, and 31 severe bronchiolitis). (*P < 0.05, **P < 0.01, ***P < 0.005, ****P < 0.001). Error bars represent ± SEM.
CD4⁺ T cell frequency showed a progressive decrease with increasing disease severity. The control group had the highest levels, which were significantly higher than those in the severe (p < 0.001) and moderate groups (p = 0.001, Fig. 1b). The absolute numbers followed a similar trend, with a significant reduction in severe and moderate bronchiolitis compared with the control and mild groups (p < 0.001, Fig. 1c).
In contrast, CD4⁺FOXP3⁺ T (Treg) cell frequency exhibited a biphasic pattern, with an initial increase in the mild group compared to controls, followed by a sharp decrease in the moderate and severe groups (Fig. 1d). The absolute number of Treg cells was comparable between healthy controls and mild cases, whereas the severe and moderate groups had significantly reduced Treg counts compared to both mild cases and controls (p < 0.001, Fig. 1e).
These results collectively indicate a depressed CD4⁺ T cell population and an increased Treg ratio in severe and moderate bronchiolitis.
Characterization of immune checkpoint molecules on Treg (CD4+FOXP3+) T cells
Expression levels of the immune checkpoint molecules CTLA-4, GARP, TIGIT, and TIM-3 on CD4⁺FOXP3⁺ T (Treg) cells were analyzed across bronchiolitis severity groups. Significant differences were observed for CTLA-4 and TIM-3 expression (p < 0.001, Fig. 2). CTLA-4 frequency was significantly higher in all disease groups compared to healthy controls. Additionally, both the severe and moderate group Treg cells expressed higher CTLA-4 compared to the mild group (p < 0.001, Fig. 2c).
Fig. 2: Expression of immune checkpoint markers TIM-3, GARP, TIGIT, and CTLA-4 on CD4+FOXP3+ (Treg) T cells in bronchiolitis severity groups.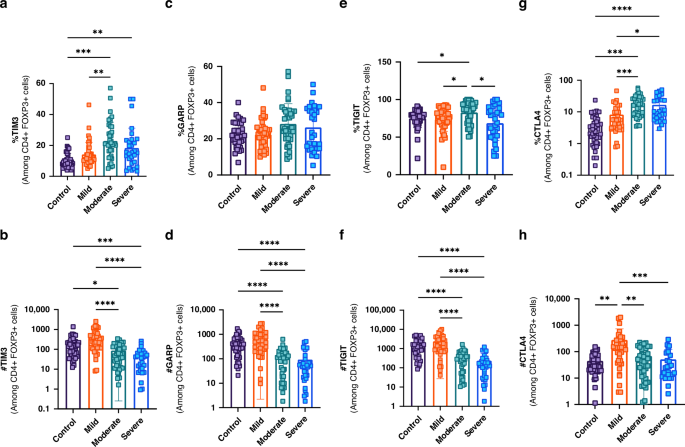
a Percentage of TIM-3⁺ CD4⁺FOXP3⁺ T cells. b Absolute number of TIM-3⁺ CD4⁺FOXP3⁺ T cells. c Percentage of GARP⁺ CD4⁺FOXP3⁺ T cells. d Absolute number of GARP⁺ CD4⁺FOXP3⁺ T cells. e Percentage of TIGIT⁺ CD4⁺FOXP3⁺ T cells. f Absolute number of TIGIT⁺ CD4⁺FOXP3⁺ T cells. g Percentage of CTLA-4⁺ CD4⁺FOXP3⁺ T cells. h Absolute number of CTLA-4⁺ CD4⁺FOXP3⁺ T cells. Statistical comparisons were made across 151 children (40 control, 40 mild, 40 moderate, and 31 severe bronchiolitis). (*P < 0.05, **P < 0.01, ***P < 0.005, ****P < 0.001). Error bars show ± SEM.
GARP expression (frequency) was comparable across groups (p > 0.05 for all), but the absolute number of GARP⁺ CD4⁺FOXP3⁺ T cells was significantly lower in severe and moderate bronchiolitis compared to controls and the mild group (p < 0.001, Fig. 2c, d). TIGIT expression showed a significant increase in the moderate group compared to controls, with a non-significant trend observed in the severe group (Fig. 2e).
TIM-3⁺ CD4⁺FOXP3⁺ T cell percentages were higher in severe and moderate bronchiolitis compared to controls (p < 0.01, p < 0.001) and the mild group (p < 0.01, Fig. 2a). However, absolute numbers were lower in the severe and moderate groups compared to controls (p < 0.005, p < 0.05) and the mild group (p < 0.001, Fig. 2b).
These results, summarized in Fig. 2, demonstrate a consistent association between increased immune checkpoint molecule expression on CD4⁺FOXP3⁺ Treg cells and increasing bronchiolitis severity.
Characterization of immune checkpoint molecules on Non-Treg (CD4+FOXP3–) T Cells
Expression levels (frequency) of CTLA-4, GARP, TIGIT, and TIM-3 on CD4⁺FOXP3⁻ T cells were analyzed across groups. Significant differences were observed for CTLA-4 and TIM-3 (p < 0.001, Fig. 3). CTLA-4 expression was highest in the severe and moderate groups, followed by the mild group, and was lowest in controls (p < 0.001, Fig. 3g).
Fig. 3: Altered expression of immune checkpoint molecules TIM-3, GARP, TIGIT, and CTLA-4 on CD4+FOXP3– (non-Treg) T cells in bronchiolitis severity groups.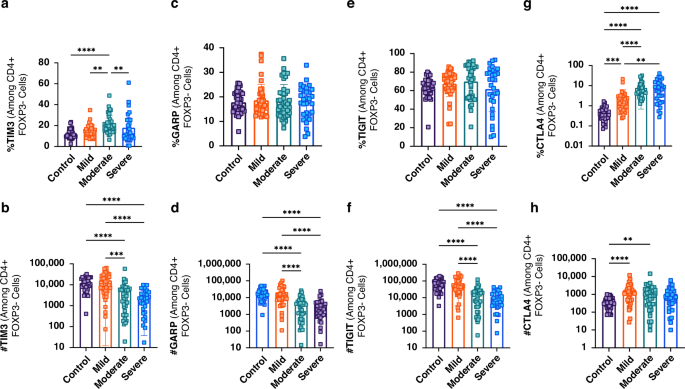
a Percentage of TIM-3⁺ CD4⁺FOXP3– T cells. b Absolute number of TIM-3⁺ CD4⁺FOXP3– T cells. c Percentage of GARP⁺ CD4⁺FOXP3– T cells. d Absolute number of GARP⁺ CD4⁺FOXP3– T cells. e Percentage of TIGIT⁺ CD4⁺FOXP3– T cells. f Absolute number of TIGIT⁺ CD4⁺FOXP3– T cells. g Percentage of CTLA-4⁺ CD4⁺FOXP3– T cells. h Absolute number of CTLA-4⁺ CD4⁺FOXP3– T cells. Statistical comparisons were made across 151 children (40 control, 40 mild, 40 moderate, and 31 severe bronchiolitis). (*P < 0.05, **P < 0.01, ***P < 0.005, ****P < 0.001). Error bars show ± SEM.
GARP and TIGIT frequencies were similar across groups (Fig. 3c–e). TIM-3 expression was highest in the moderate group, followed by the mild and severe groups, with the lowest levels in controls (Fig. 3a). Absolute numbers of TIM-3⁺, GARP⁺, and TIGIT⁺ CD4⁺FOXP3⁻ T cells were significantly lower in the severe and moderate groups compared to both controls and the mild group (p < 0.001, Fig. 3b, d and f). In contrast, CTLA-4⁺ CD4⁺FOXP3⁻ T cell counts were elevated in the moderate (p < 0.01) and mild (p < 0.001) groups compared to controls (Fig. 3h).
Together, these results further support increased immune checkpoint expression correlating with bronchiolitis severity.
Soluble Cytokine and immune checkpoint molecule levels in bronchiolitis
Levels of IL-2Rα, 4-1BB, TGF-β1, LAG-3, CTLA-4, galectin-9, and CD86 were measured in plasma using enzyme-linked immunosorbent assay (ELISA). Significant differences were observed among groups for most markers (p < 0.05, Fig. 4).
Fig. 4: Soluble cytokine and immune checkpoint molecule levels in bronchiolitis severity groups and controls.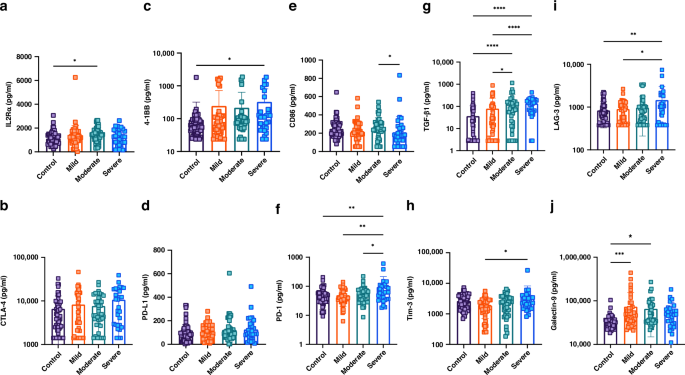
Levels of soluble cytokines and immune checkpoint molecules, including IL-2Rα, CTLA-4, 4-1BB, PD-L1, CD86, PD-1, TGF-β1, TIM-3, LAG-3, and galectin-9, were measured in plasma samples from all bronchiolitis severity groups and healthy controls. a IL-2Rα, b CTLA-4, c 4-1BB, d PD-L1, e CD86, f PD-1, g TGF-β1, h TIM-3, i LAG-3, j Galectin-9. Significant differences were observed for most markers, with notable elevations in TIM-3, LAG-3, and TGF-β1 levels in the severe bronchiolitis group. Statistical comparisons were made across 151 children (40 control, 40 mild, 40 moderate, and 31 severe bronchiolitis). (*P < 0.05, **P < 0.01, ***P < 0.005, ****P < 0.001). Error bars represent ± SEM.
IL-2Rα was elevated in the moderate group compared to controls (p = 0.04), while CTLA-4 and PD-L1 levels did not significantly differ (Fig. 4a, b and d). 4-1BB levels were significantly higher in the severe group compared to controls (p = 0.008, Fig. 4c). CD86 levels were reduced in the severe group compared to the moderate group (p = 0.02, Fig. 4e).
PD-1 was highest in the severe group compared to controls (p < 0.01), moderate (p < 0.05), and mild groups (p < 0.01, Fig. 4f). TGF-β1 was significantly increased in both the moderate and severe groups compared to controls (p < 0.001), and also higher in the severe versus mild group (p < 0.005), and moderate versus mild group (p < 0.05, Fig. 4g).
TIM-3 and LAG-3 levels were higher in the severe group compared to mild (p < 0.05) and control (p < 0.01) groups, respectively (Fig. 4h, i). Galectin-9 levels were significantly higher in the mild (p < 0.005) and moderate (p < 0.05) groups than in controls (Fig. 4j). Collectively, the analyses of plasma levels of the investigated molecules also support increased immunosuppressive milieu with increased bronchiolitis severity.


