

Reduced GPRC5D expression in monoallelic GPRC5D models is associated with decreased treatment response to talquetamab
We analyzed an extended MM patient cohort (n = 399) prior to treatment with GPRC5D- or BCMA-directed immunotherapies and observed a baseline frequency of 13.0% monoallelic GPRC5D alterations. Upon acquired resistance to talquetamab, this frequency increased significantly to 25.0% patients showing monoallelic and an additional 35.0% patients showing biallelic GPRC5D loss. However, this frequency remained 11.5% in patients treated with anti-BCMA agents (Fig. 1A). To study the mechanistic impact of GPRC5D loss in MM cells, monoallelic and biallelic GPRC5D models were generated using OPM-2 and CRISPR-Cas9 technology. RT-PCR profiling showed a 2.1-fold reduction in GPRC5D expression in GPRC5DWT/Del cells and a 98% reduction in GPRC5DDel/Del cells (Fig. 1B). Bulk RNA-seq confirmed reduction in GPRC5D expression at transcript level with 186 vs. 67.7 (p = 0.011) vs. 15.6 (p = 0.002) transcripts per million (TPM) in GPRC5DWT vs. GPRC5DWT/Del vs. GPRC5DDel/Del models (Fig. 1C) and was confirmed by digital droplet PCR (ddPCR) (Figure S1) and Sanger sequencing. IHC and dSTORM ultra high-resolution single molecule microscopy were subsequently employed to confirm the reduction in GPRC5D expression at protein level (Fig. 1D). dSTORM revealed a significant reduction in GPRC5D surface expression on GPRC5DWT/Del (0.35 ± 0.02 clusters/µm2) vs. WT cells (1.89 ± 0.10 clusters/µm2, p < 0.0001). GPRC5DDel/Del models had barely detectable GPRC5D expression with 0.03 ± 0.07 clusters/µm2 (p < 0.0001, Fig. 1E, F). To investigate if sensitivity to GPRC5D-directed treatments would decline with reduced GPRC5D expression, cells were next treated with 2.5 µg/ml talquetamab at an E:T ratio of 10:1 for 48 h. GPRC5DWT/Del cells showed a 3.3-fold increase in talquetamab resistance as compared to GPRC5DWT cells (p < 0.0001) whereas complete resistance was observed for GPRC5DDel/Del models (p < 0.0001) (Fig. 1G). Different E:T ratios were tested, with no significant variation in outcome observed across tested conditions (Fig. S2).
Fig. 1: Spectrum of clinical GPRC5D alterations and functional characterization of GPRC5D-deficient in vitro models.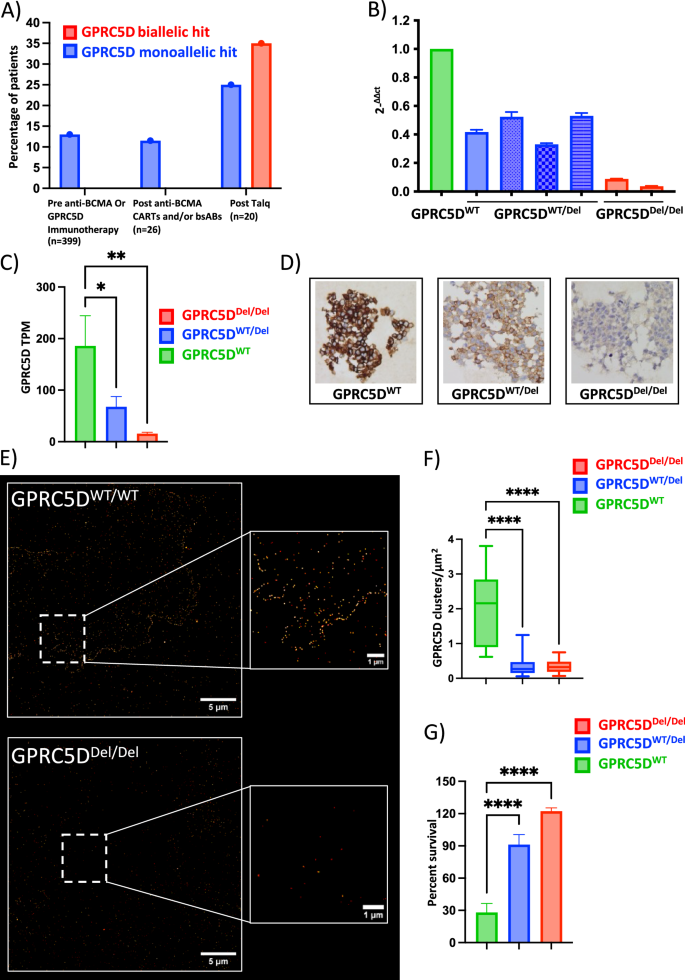
A Frequency and mutational make-up of GPRC5D alterations in a MM patient cohort without prior anti-GPRC5D/BCMA exposure (n = 399), after anti-BCMA therapy (n = 26) and at the time of relapse to anti-GPRC5D bispecific antibody treatment (n = 20). Data collected at University of Wuerzburg Medical Center and based on available WGS data. B qPCR analysis of OPM-2 MM cell models with monoallelic GPRC5D deletion (GPRC5DWT/Del, blue) and biallelic GPRC5D loss (GPRC5DDel/Del, red) as normalized to GPRC5DWT models (green). C Transcriptomic analysis represented as transcripts per million (TPM) in GPRC5DWT and deficient cell models. D Representative images from immunohistochemistry analysis. E Representative images of GPRC5D cell models as objectified by dSTORM microscopy and F quantified as clusters/µm2. G Bioluminescence-based cell survival analysis performed on GPRC5D models treated with 2.5 µg/ml talquetamab for 48 h. GPRC5DWT cells are represented in green, GPRC5DWT/Del cells are represented in blue and GPRC5DDel/Del cells are represented in red. *p < 0.05, **p < 0.005 ***p < 0.001, ****p < 0.0001.
These data indicate that even monoallelic loss of GPRC5D leads to therapeutically relevant reductions in GPRC5D expression and drives partial resistance to talquetamab in preclinical cell line models.
GPRC5D deficiency increases baseline proliferation of MM cells
To investigate the biological implications of GPRC5D loss on the cellular homeostasis of MM cells, we performed bulk RNA-seq on GPRC5DWT, GPRC5DWT/Del and GPRC5DDel/Del cell line models. Differential expression analysis revealed 1952 upregulated and 2165 downregulated genes in GPRC5DWT/Del, and 2074 upregulated and 1842 downregulated genes in GPRC5DDel/Del as compared to GPRC5DWT cells (padj = 0.05) (Fig. 2A, B). Downstream characterization by gene set enrichment analysis (GSEA) confirmed a total of 39 pathways to be consistently dysregulated in both single- and double-hit GPRC5D models (Fig. 2C), whereof, most prominently, we observed enrichment of pro-proliferative signaling programs such as PI3K, MAPK, and JAK-STAT pathways in GPRC5D-deficient vs. -WT models (Fig. 2D, E). Changes at protein level were assessed by mass spectrometry (MS)- based proteomics, with quantification of phosphoproteome levels using TMT as a labeling reagent. This unbiased approach corroborated our findings by recapitulating a pattern of increased proliferation and cell cycling in GPRC5DDel/Del vs. GPRC5DWT cells, including functional enrichment of potentially targetable kinase motifs such as Aurora B (EF = 12.03, FDR < 0.0001), Aurora A (EF = 7.99, FDR < 0.0001) and PAK2 substrates (EF = 4.74, FDR < 0.0001) (Fig. 2F, G), and additional enrichment of other kinases such as p70 ribosomal S6 kinase (EF = 4.2, FDR < 0.0001), calmodulin dependent protein kinase II (EF = 1.9, FDR = 0.01) PKACA (EF 8.9, FDR < 0.0001) and PKC epsilon kinase (EF = 5.4, FDR < 0.0001), the latter all being involved in the cellular proliferation signaling (Fig. 2G). To determine if the observed transcriptomic and phosphoproteomic alterations have an impact on the functional properties of MM cells, we next performed clonal competition assays between GPRC5DWT and GPRC5DDel/Del cells. In a co-culture starting with a 1:9 Del/Del:WT ratio, GPRC5DDel/Del cells showed a clear growth advantage, reaching over 90% of the entire population by day 11 (Fig. 3A). The dominance of GPRC5DDel/Del was even more pronounced when starting at a 1:1 ratio, exceeding 90% of the whole population by day 8 (Fig. 3B).
Fig. 2: Transcriptomic and phosphoproteomic landscape of GPRC5DWT and deficient models.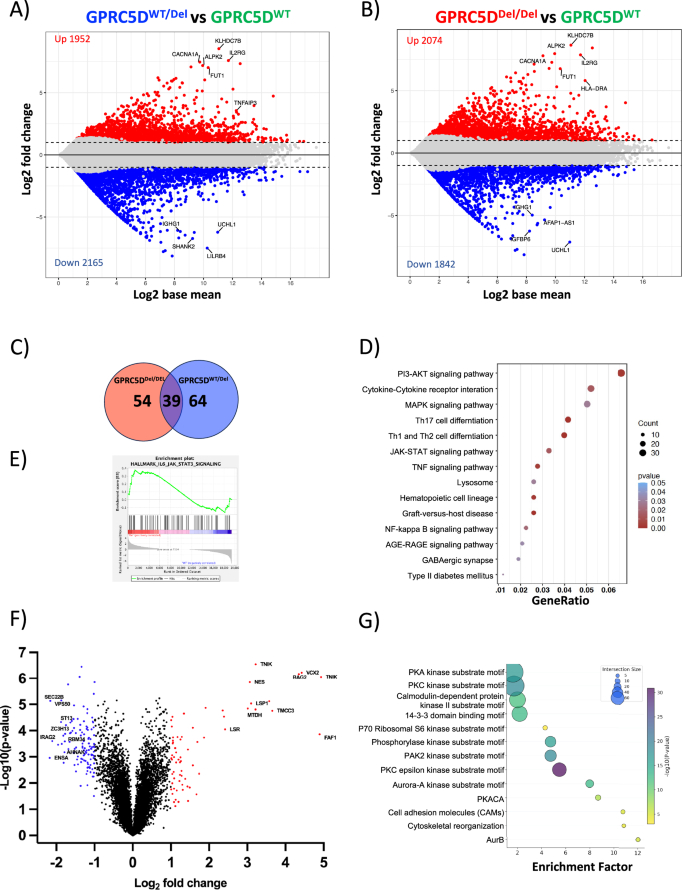
Plots indicating gene expression differences between GPRC5DWT/Del vs. GPRC5DWT models (A) and between GPRC5DDel/Del vs. GPRC5DWT models (B). Differentially expressed genes with an adjusted p value < 0.05 and a log 2FC > │1│ are depicted in colors. C Venn diagram of overlapping DEG in GPRC5DDel/Del and GPRC5DWT/Del cell models. D Dot plot of enriched pathways overlapping between GPRC5DDel/Del and GPRC5DWT/Del models. E Enrichment plots of JAK-STAT3 pathway from GSEA. Enrichment profile is indicated as green line. F Volcano plot showing differentially expressed phosphosites between GPRC5DDel/Del and GPRC5DWT models at a log 2FC > │2│changed. G Perseus analysis depicting enriched pathways at phosphoproteomic level between GPRC5DDel/Del and GPRC5DWT models.
Fig. 3: Functional impact of GPRC5D alterations.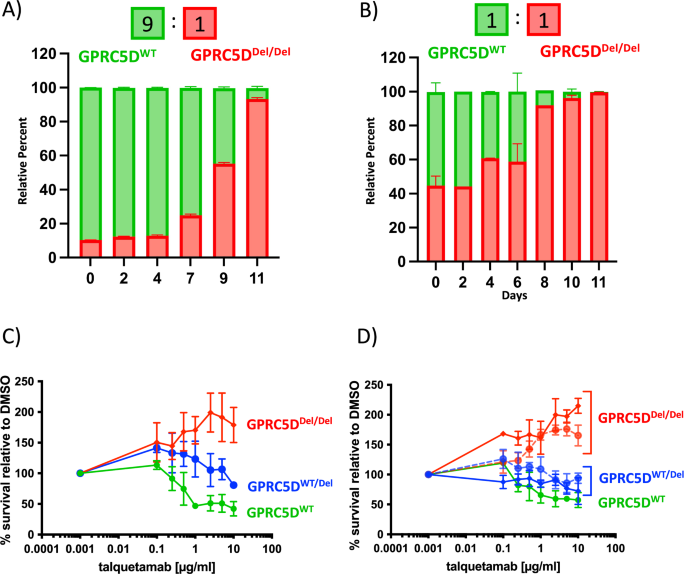
Clonal competition assay showing the selection dynamics of co-cultures over 11 days with a 9:1 (A) and 1:1 (B) starting ratio for GPRC5DWT vs. GPRC5DDel/Del cells. C Talquetamab titration curve performed on GPRC5D models. Cells were treated with talquetamab for 48 h and luciferin-based cytotoxicity assay was performed. T cells from three different healthy donors were used as effector cells. D Additionally, two clones for each type of genetic alteration were treated with talquetamab. GPRC5DWT cells are represented in green. GPRC5DWT/Del cells are represented in blue and GPRC5DDel/Del cells are represented in red.
Collectively, these findings demonstrate that GPRC5D loss perturbs MM cell homeostasis through transcriptomic and phosphoproteomic networks that favor increased proliferative capacity as compared to GPRC5DWT cells.
Talquetamab selects for highly proliferative phenotypes in absence of GPRC5D expression
To further investigate the effects of talquetamab treatment on GPRC5D-deficient cells, we treated our models with talquetamab. Unexpectedly, and while GPRC5DWT cells exhibited a clear dose-dependent killing upon talquetamab exposure, the proliferative capacity in GPRC5DDel/Del models was even further enhanced by the presence vs. absence of talquetamab treatment (Fig. 3C). This gain in proliferation was not observed when cells were incubated with talquetamab in absence of T cells (Fig. S3). To rule out a clone-specific artifact, we performed talquetamab titrations across multiple GPRC5D clones harboring either monoallelic or biallelic alterations and observed a similar proliferative response across all models (Fig. 3D). Notably, the activity of classical anti-MM therapies such as melphalan, alkylating agents, bortezomib, or lenalidomide remained unaltered (Fig. S4).
Potential off-target effects of talquetamab were ruled out by investigating alternative binding of talquetamab on GPRC5D-deficient MM cells by studying fluorochrome-labeled talquetamab in dSTORM microscopy (Fig. 1E, F). To investigate putative mechanisms, by which talquetamab treatment could potentially result in increased proliferation of GPRC5DDel/Del MM cells, we next performed mass spectrometry analysis in talquetamab-treated GPRC5DDel/Del versus GPRC5DWT models. This comparison revealed 83 up- and 99 downregulated phosphosites in talquetamab-treated GPRC5DDel/Del models (Fig. S5). These mostly overlapped with those seen in talquetamab-naïve GPRC5DDel/Del models (Fig. 2F).
Manual enrichment examination of the phosphosites did not result in clear evidence for an alteration of the phosphoproteome through talquetamab treatment. This suggests that the proliferative advantage conferred by talquetamab may occur independently of broad phosphoproteomic changes or that such changes were below the limit of detection, indicating that the additional talquetamab-induced stimulus on the proliferation of GPRC5DDel/Del cells is not intrinsically linked to potential off-target effects of talquetamab, but seems to rather arise from the competitive advantage of GPRC5DDel/Del cells after elimination of GPRC5DWT cells, with more favorable growth conditions, including cytokine and nutrient supply for the remaining GPRC5DDel/Del clones.
Talquetamab alters T cell transcriptome in presence of GPRC5D on MM cells
To better understand the impact of talquetamab on T cells in the presence of GPRC5D on MM cells, we performed CITE-seq. T cells were cocultured with or without talquetamab. We confirmed our previous observation that loss of even a single GPRC5D allele results in transcriptomic alterations in MM cells as seen by entirely different clustering profiles of GPRC5DWT and deficient cells (Fig. 4A).
Fig. 4: Single-cell RNA-seq of cocultures to identify transcriptional T cell responses to talquetamab and GPRC5D.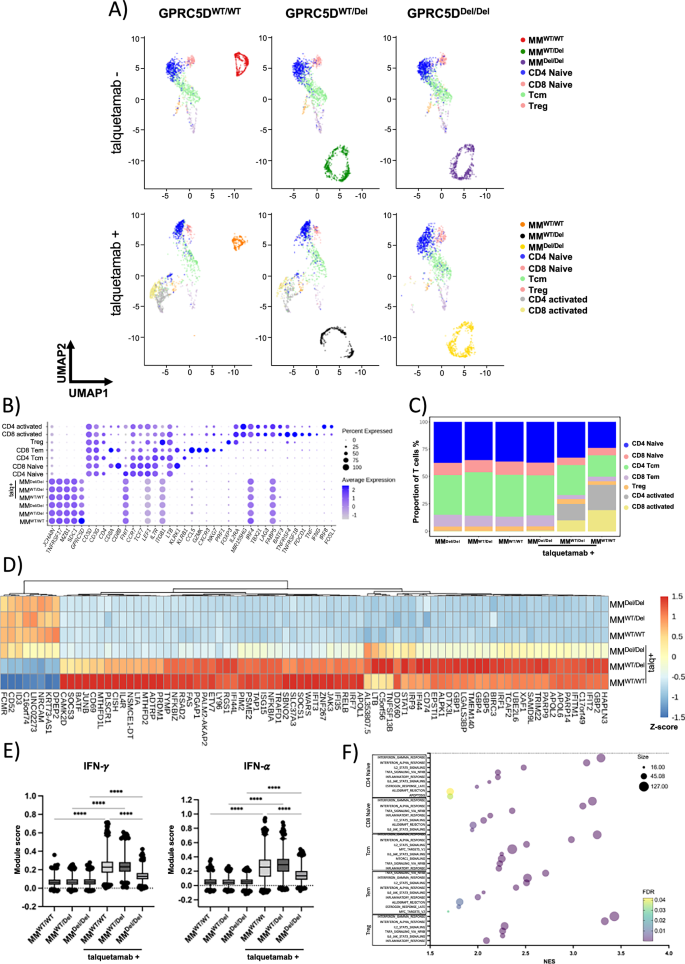
A UMAP representation of single-cell transcriptomes of T cell/MM coculture cells stratified by MM cell-line and talquetamab treatment with cells colored according to their annotation. B Dotplot of scaled expression (color) of selected marker genes used for annotation of MM cells and T cell subtypes. Dot size depicts the percentage of non-zero expressing cells. C Relative abundance of T cell subpopulations across coculture conditions. D Heatmap showing z-scores of mean log-normalized expression for differentially expressed genes (padj <0.001, absolute avg_log2FC > 2) in T cells between talquetamab and control across all coculture conditions. E Boxplots depicting single-cell IFN-γ (left) and IFN-α (right) module scores across coculture conditions. The center line indicates the median, the box limits indicate the upper and lower quantiles, and the whiskers indicate 1.5× interquartile range. Statistical significance was determined using two-way ANOVA (**** p value < 0.001). F GSEA results for upregulated genes within shared T cell subpopulations between talquetamab and control in GPRC5DWT.
Based on the expression of canonical marker genes, we identified CD4 and CD8 naïve T cells, CD4 central memory T cells (CD4 Tcm), CD8 effector memory T cells (CD8 Tem) and CD4 regulatory T cells (Treg). In addition, we identified CD4 and CD8 T cells marked by expression of activation genes (IL2RA, TNFRSF4, TNFRSF18), as well as TNF and IFNG (Fig. 4B). As expected, activated T cells were only observed when talquetamab was added to the coculture with GPRC5DWT or GPRC5DWT/Del MM cells, but not with GPRC5D deficient MM cells (Fig. 4A, C).
We assessed gene expression changes in the T cell populations induced by talquetamab, cocultured with GPRC5D expressing MM cells (Table S3). A significant upregulation of interferon stimulated genes (GBP2, GBP4, GBP5, IFI44, IFIT2, ISG15) was found in T cells cocultured with GPRC5D expressing cells and talquetamab, while interferon signaling genes (STAT1, IRF1) were already induced by talquetamab alone (Fig. 4D). Scoring of interferon responses across T cells confirmed an increase in T cells cocultured with talquetamab that was increased in presence of GPRC5D expressing MM cells (Fig. 4E). We also identified genes which were only upregulated in presence of GPRC5D and talquetamab, including SOCS3, CD69, JUNB, BATF, CISH, and PRDM1, indicating a unique activation status. Notably, these responses were markedly pronounced in coculture with GPRC5DWT as compared to GPRC5DWT/Del MM cells (Fig. 4D).
Gene set enrichment analysis (GSEA) confirmed upregulation of interferon responses (IFN-γ: NES 2.97, FDR 0.0; IFN-α: NES 2.87, FDR 0.0), and further showed upregulation of IL2-STAT5 signaling (NES 2.13, FDR 0.0), TNFA signaling (NES 2.23, FDR 0.0) and inflammatory response (NES 2.08, FDR 0.0) in T cells after coculture with GPRC5D expressing MM cells and talquetamab as compared to cocultures without talquetamab (Fig. 4F). Of note, T cells did not respond to presence or absence of GPRC5D on MM cells in the absence of talquetamab, and their transcriptomic profile remained unchanged (Table S4).
Our findings demonstrate that talquetamab upregulates the expression of interferon signaling genes in T cells and while this response is enhanced when GPRC5D is present on MM cells, it also occurs in KO models. Moreover, talquetamab alters the activation profile across T cells subsets and both abundance and distribution of different T cells subpopulations is changed by GPRC5D status of MM cells in coculture.
Talquetamab treatment alters chemokine profile in T cell co-culture with GPRC5D-deficient myeloma cells
To account for talquetamab-induced alterations within the chemokine niche, we next characterized the supernatants of T cell/GPRC5DDel/Del co-cultures in the presence vs. absence of talquetamab. After 20 h of incubation, we observed a significantly elevated secretion of IL-2 and IFN-γ in co-cultures with vs. without talquetamab (Fig. 5A). An expanded screen covering 120 cytokines by high-content chemokine profiling (Fig. 5B) revealed 21 differentially expressed cytokines in GPRC5DWT and 28 in GPRC5DDel/Del models upon exposure to talquetamab treatment, with all relative expression levels of cytokines being summarized in Fig. 5C. Specifically, pro-inflammatory cytokines such as CCL3, CCL4, CCL8, and IL-8 were enriched in talquetamab-treated GPRC5DWT co-cultures, whereas cytokines associated with cell growth and proliferation, including CCL28, IL-34, HGF, and CXCL9, were overexpressed in talquetamab-exposed GPRC5D-deficient co-cultures (Fig. 5D).
Fig. 5: Cytokine quantification for functional profiling of T cells in the presence vs. absence of GPRC5D.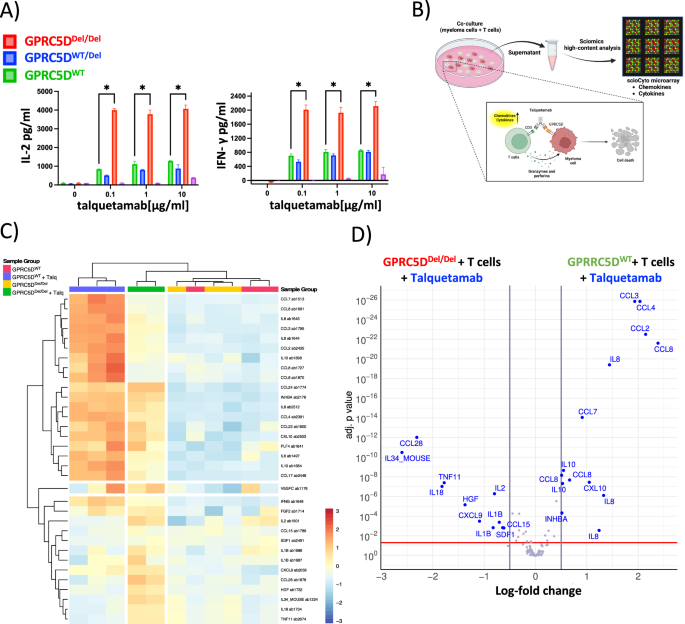
A Bar graphs representing the levels of IL-2 and IFN-γ in the supernatant. GPRC5D cell models (WT and knock-out) were treated with different talquetamab concentrations for 24 h and the supernatants were analyzed for cytokine production. T cells from two different healthy donors were used as effector cells (negative control is represented in magenta). B Graphical representation of experimental setup for high-content chemokine profiling. C Heatmap of 120 chemokines analyzed by scioCyto microarray assay. D Volcano plot showing differentially produced cytokines in GPRC5DDel/Del and GPRC5DWT models. Differentially produced cytokines with an adjusted p < 0.05 and a log 2FC > │0.5│ are depicted in blue color.
These findings indicate that T cells produce distinct cytokine profiles depending on the GPRC5D expression status of MM cells and the respective co-treatment with talquetamab. This differential cytokine milieu may contribute to the proliferative phenotype observed in GPRC5D-deficient models, highlighting a potential interplay between immune activation and tumor cell-intrinsic responses in the context of GPRC5D deficiency.
GPRC5D-deficient MM cells show comparable competitive advantage with CAR-T and MOCK T cells
In a next step, we tested the proliferative advantage of GPRC5DDel/Del models in the context of anti-GPRC5D CAR-T cells. First, an in-house CAR-T product which harbors an antigen recognition domain identical to talquetamab (CAR-T-Talq, Fig. 6A), induced dose-dependent killing of GPRC5DWT at E:T ratios of 5:1 and 10:1 and after incubation periods of 24, 48, and 72 h, whereas the same product expectedly had no cytolytic effect in GPRC5DDel/Del and GPRC5DWT/Del models (Fig. 6B–F). To validate these findings, a second CAR construct with identical antigen recognition as in MCARH109 (CAR-T-GPRC5D) was tested and induced similar dose-dependent cell killing of GPRC5DWT cells (Fig. 6G–J). GPRC5DWT/Del and GPRC5DDel/Del models displayed significantly reduced sensitivity across all E:T ratios. Although prolonged co-culture (48–72 h) improved the cytolytic activity against WT cells, GPRC5D-deficient models consistently maintained an overall insensitive profile (Fig. 6K, L). A significant reduction in IFN-γ production by CAR-T cells was observed after coculture with GPRC5D deficient MM cell models compared to WT cells (Fig. S6). Clonal competition assays were next conducted with GPRC5DWT and GPRC5DDel/Del cells at different ratios (3:1 and 1:1). Upon selective pressure with CAR-T-Talq (Fig. 7A–D) or CAR-T-GPRC5D (Fig. 7E–H), both CAR-Ts preferentially eliminated WT cells, resulting in a relative enrichment of GPRC5D-deficient clones over time. Interestingly, simultaneous co-culture experiments using MOCK T cells, that had been cultured analogously to both CAR-T products, led to a delayed but significant increase of GPRC5DDel/Del cells within the competition assay by day 6 of co-culture (Fig. 7I–L).
Fig. 6: Sensitivity of GPRC5D models towards anti-GPRC5D CAR-T cells.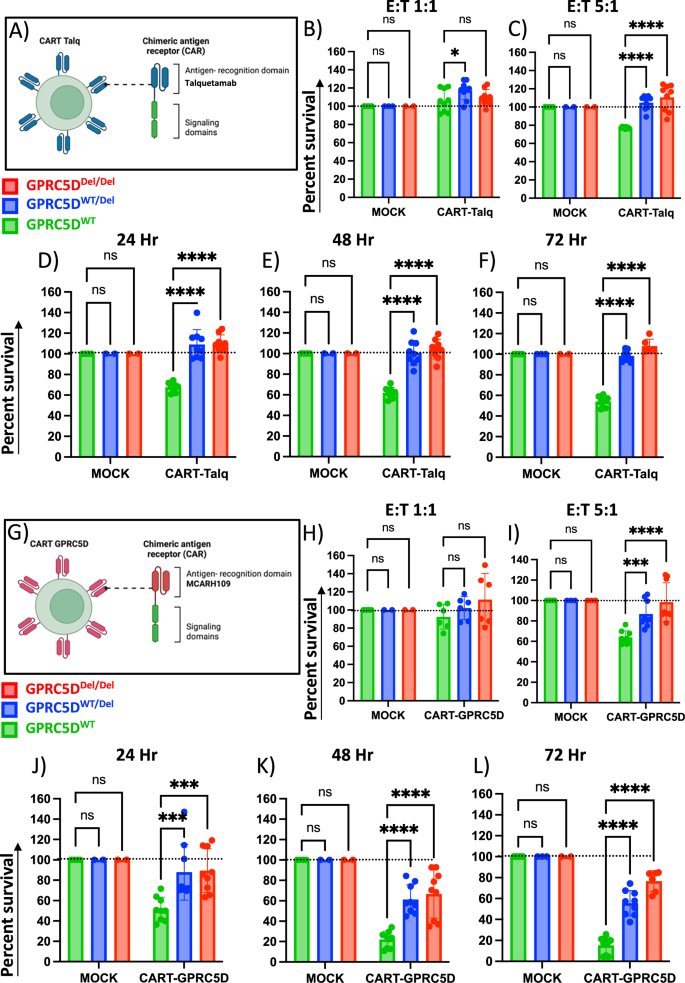
A Graphical design of CAR-T-Talq cells. Killing efficacy of CAR-T-Talq CAR-T cells after co-incubation with GPRC5D cell models at E:T ratios of 1:1 (B), 5:1 (C) and 10:1 (D) after 24 h of incubation. CAR-T-Talq killing efficacy at 48 h (E) and 72 h (F) using E:T ratios of 10:1. Data normalized to MOCK T cells. G Graphical design of CAR-T-GPRC5D cells. Killing efficacy of CAR-T-GPRC5D CAR-T cells after co-culture with GPRC5D cell models at E:T ratio of 1:1 (H), 5:1 (I) and 10:1 (J) after 24 h of incubation. CAR-T-Talq killing efficacy at 48 h (K) and 72 h (L) using E:T ratios of 10:1. GPRC5DWT cells are represented in green. GPRC5DWT/Del cells are represented in blue and GPRC5DDel/Del cells are represented in red. Data normalized to MOCK T cells. *p < 0.05, **p < 0.005 ***p < 0.001, ****p < 0.0001.
Fig. 7: Clonal competition assays performed under selection pressure with anti-GPRC5D CAR-T cells.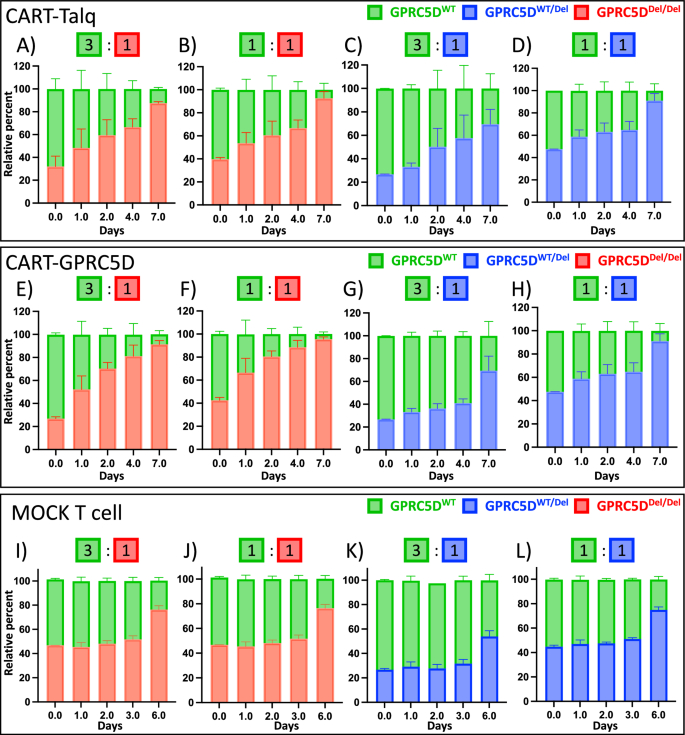
Clonal competition assays were performed with CAR-T-Talq (A–D), CAR-T-GPRC5D (E–H), and MOCK T cells (I–L) at E:T ratios of 1:1 with either GPRC5DDel/Del or GPRC5DWT/Del mixed with GPRC5DWT at starting ratios of 1:3 or 1:1.
Taken together, this data suggests that target antigen loss depicts an expected immune evasion mechanism which can equally occur in MM cells with bi- but also monoallelic GPRC5D alterations. Beyond antigen loss, GPRC5D deficiency however also increased the basal proliferation rate of MM cells thereby providing a competitive advantage which was further amplified by selecting these aggressive phenotypes during ongoing treatment with anti-GPRC5D immunotherapies.


