

Vaccination timeline and anti–SARS-CoV-2 IgG antibody response during pregnancy
To capture dynamic changes in immune cell composition and gene expression following COVID-19 vaccination during pregnancy, serum and PBMC samples were collected from three pregnant participants. Serum was used to measure anti–SARS-CoV-2 IgG antibody levels, whilst PBMCs underwent single-cell RNA sequencing. The timeline of sample collection is illustrated in Fig. 1A. All participants received two doses of COVID-19 vaccine during the study period. PBMCs were collected at four timepoints: T1, before vaccination; T2, 6 days after the first dose; T3, 13 days after the first dose; and T4, more than 2 months after the first dose, following the second dose and delivery. Due to delivery timing differences, the sample collection for PG_3 was delayed. Participants’ ages ranged from 33 years to 35 years. To evaluate the effectiveness of the COVID-19 vaccination, anti–SARS-CoV-2 IgG concentrations were measured in serum samples collected at four timepoints following vaccination. The results are shown in Fig. 1B. The detection range of the assay was 0.40–250 U/mL. No IgG antibodies were detected at T1 and T2. At T3, the average antibody concentration reached 17.6 U/mL, which indicated a modest increase. By T4, antibody levels reached the upper detection limit (250 U/mL) in all donors. These findings indicate that a single dose of the Moderna mRNA vaccine was insufficient to elicit a robust antibody response within the first week, and only a slight increase was observed by the second week. A substantial antibody response was achieved only after administration of the second dose. Raw IgG concentrations for each donor are shown in Fig. 1B.
Fig. 1: Study design and anti-SARS-CoV-2 IgG antibody levels in pregnant individuals following COVID-19 vaccination.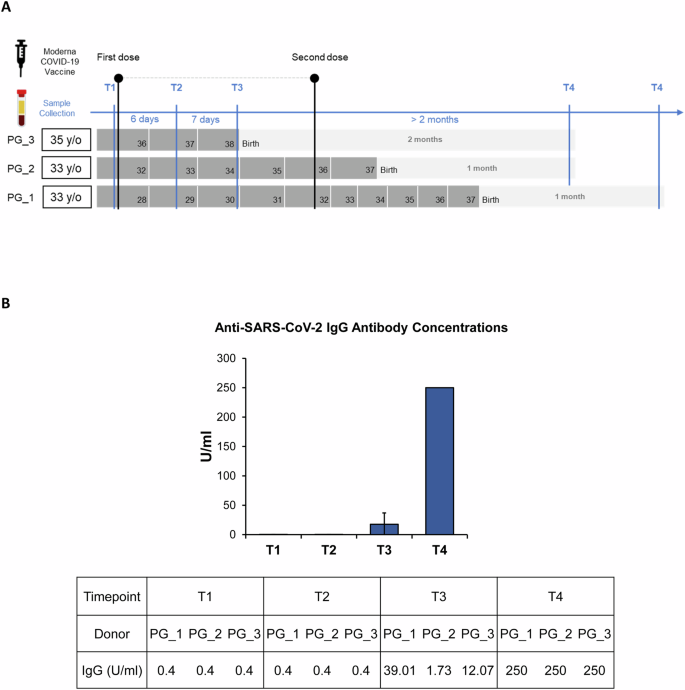
A Schematic timeline of blood sample collection from three pregnant individuals across four time points during vaccination and postpartum follow-up. B Average concentrations of anti-SARS-CoV-2 IgG antibodies (U/ml) across the four time points in the pregnant group.
Single-cell profiling of PBMCs from vaccinated pregnant donors
To explore pregnancy-associated immune responses to vaccination, scRNA-seq was performed on PBMCs from the three participants. A total of 11,731 cells were analysed and clustered using UMAP after doublet removal with DoubletFinder (Fig. S1A). Sixteen transcriptionally distinct clusters (Fig. S1B) were identified, and the cell types were annotated based on the expression of canonical lineage markers and other cluster-specific upregulated genes. These included monocytes (CD14, FCGR3A and LYZ), T cells (CD3D, CD3E, CD4, CD40LG, CD8A and CD8B), B cells (MS4A1, CD19, CD79A and IGHM), dendritic cells (CLEC4C, LILRA4, TCF4 and IRF7), NK cells (FCGR3A, NKG7, NCAM1, KLRD1 and KLRF1), megakaryocytes (TUBB1 and PF4) and erythrocytes (HBD and HBM). These were grouped into 11 canonical immune cell types (Figs. 2A, B). Figure 2C shows the distribution of representative marker genes on the UMAP. Figures S1C and S1D present representative lineage markers and the top 10 highly expressed genes for each cluster. Figure S1E illustrates the UMAP clustering profiles of PBMCs for each donor (top) and across timepoints (bottom), and T4 shows a particularly distinct distribution.
Fig. 2: Single-cell immune atlas and composition dynamics of PBMCs in pregnant individuals following COVID-19 vaccination.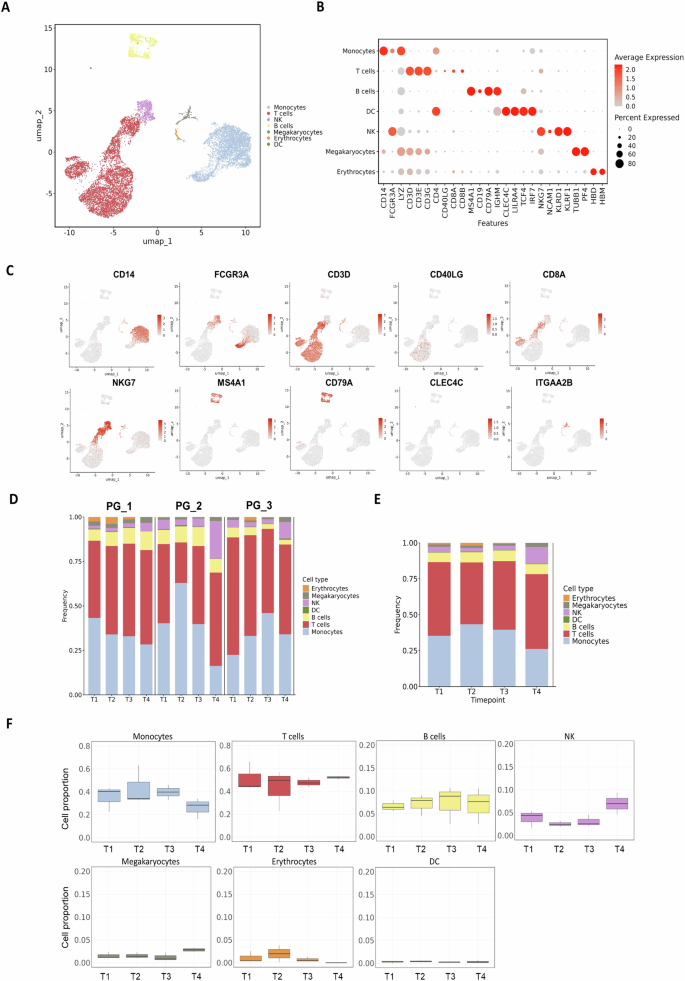
A UMAP visualisation of single-cell transcriptomes from PBMCs collected at all timepoints from pregnant individuals, annotated by major immune cell types. Each dot represents one cell. B Dot plot showing the expression of canonical marker genes for each identified immune cell type. Dot size indicates the percentage of cells expressing the gene, and colour intensity reflects the average expression level. C UMAP showing the expression of representative marker genes for major immune cell types in PBMCs, including monocytes (CD14 and FCGR3A), T cells (CD3D, CD8A and CD40LG), NK cells (NKG7), B cells (MS4A1 and CD79A), dendritic cells (CLEC4C) and platelets (ITGA2B). Colour indicates expression level. D Bar plots summarising the relative abundance of each immune cell type across timepoints for individual donors. E Average cell type composition across all pregnant donors. F Box plots quantifying the proportions of each major immune cell type across timepoints. No significant differences were observed between timepoints for any major cell population.
To assess PBMC composition over time, the proportion of each cell type was calculated across timepoints (Fig. 2D), and the average distributions are shown in Fig. 2E. Boxplots indicate that the relative frequencies of all cell types remained largely stable, and no significant changes were observed over time (Fig. 2F). Overall, monocyte and B cell frequencies slightly increased after the first vaccination (T2), whereas T cells and NK cells decreased, though without statistical significance.
Monocytes subset dynamics following COVID-19 vaccination in pregnancy
Monocytes are key effector cells of the innate immune system. Previous studies have shown that they act as major drivers of inflammation during COVID-19 infection, particularly CD14⁺ classical monocytes [11]. Monocytes were further classified into classical monocyte_1 (cM_1), classical monocyte_2 (cM_2), classical monocyte_3 (cM_3) and nonclassical monocytes (ncM) based on transcriptional profiles (Figs. 3A and S2A–B). All classical subsets highly expressed CD14, whereas ncM expressed FCGR3A (CD16). Amongst them, cM_1 showed strong expression of proinflammatory genes (IL1B, NLRP3 and NFKB1), which suggested a highly activated phenotype; cM_3 expressed immediate early genes (FOS, JUN, EGR1 and IER2) related to stimulation and signal transduction (Fig. 3B). Figure 3C shows the expression of these key genes in UMAP, where cM_1 formed a cluster enriched for IL1B, NLRP3 and NFKB1, whereas TGFB1 showed no significant difference between subgroups.
Fig. 3: Transcriptional heterogeneity and dynamic changes of monocyte subsets following COVID-19 vaccination in pregnancy.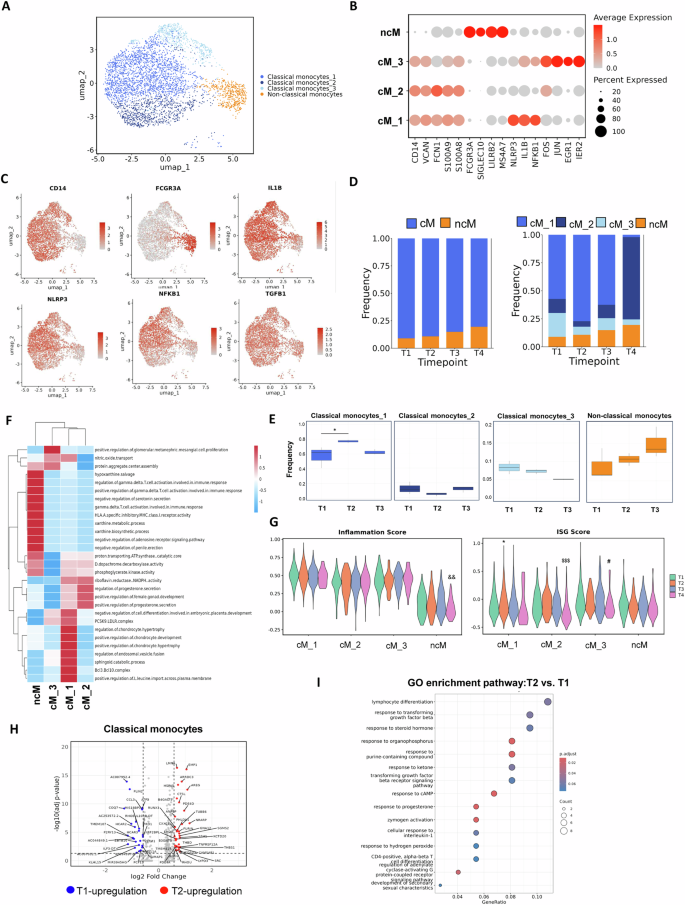
A UMAP showing transcriptional subclusters of monocytes from PBMCs across all timepoints. B Dot plot showing key marker genes for classical and nonclassical monocytes. C UMAP plots displaying representative marker genes and inflammation-related gene expression across monocyte subsets. D Stacked bar plots showing the proportions of cM and ncM (left) and further resolution of classical monocyte subclusters (cM_1, cM_2 and cM_3; right) across four timepoints (T1–T4). E Box plots showing the frequency of each monocyte subcluster over time. *p < 0.05 compared with T1, Wilcoxon rank-sum test. F Gene set variation analysis (GSVA) showing differential pathway activity across monocyte subclusters. G Violin plots showing inflammation and ISG scores across subsets using AddModuleScore. Symbols indicate significant changes versus T1 in each subset: *cM_1, $cM_2, #cM_3 and &ncM. H Volcano plot showing DEGs between T2 and T1 within cMs. I GO enrichment analysis of DEGs between T2 and T1 in cMs.
To assess immune dynamics after vaccination, monocyte proportions were compared across timepoints. The total proportion of classical monocytes showed no major change; however, cM_1 increased at T2 and returned to baseline (T1) by T3 (Figs. 3D, E and S2C). To explore subset function, GSVA enrichment analysis was performed (Fig. 3F): cM_1 was the main inflammatory effector subset enriched in inflammatory and T cell activation pathways; cM_2 expressed RPS/RPL genes with stable antimicrobial and metabolic features; and cM_3 was enriched in MAPK, cAMP and TGF-β pathways, representing an AP-1–driven early-sensing subset involved in immune modulation. Differential expression and GO analysis comparing T2 with T1 classical monocytes (Fig. 3H, I) revealed enrichment in lymphocyte differentiation, TGF-β response, steroid hormone response and GPCR signalling regulation, which suggested that monocytes after the first vaccine dose mainly participated in metabolic regulation and immune coordination without a strong inflammatory response. This outcome aligns with reports that the first vaccine dose induces immune priming, whereas robust inflammation or humoral responses typically follow the second dose [9, 12]. Overall, in pregnant women, the first COVID-19 vaccine dose caused a transient rise in inflammatory cM_1 cells one week postvaccination, but the overall monocyte response remained moderate.
At T4, the cM_1 population was largely replaced by cM_2 (Figs. 3D and S2D). This sample was collected over a month after the second vaccine dose and delivery. GSVA analysis showed that whilst cM_2 retained partial cM_1-like functions, it lacked several pathways, including the PCSK9–LDLR complex, endosomal vesicle fusion, sphingolipid catabolism, BCL3/10 complex and transmembrane leucine import, all related to lipid metabolism and inflammatory signalling. Dot plots showed lower IL1B, NLRP3 and NFKB1 expression in cM_2. GO analysis further indicated that compared with T4, T3 displayed stronger responses to viruses, inflammation and lymphocyte adhesion (Fig. S2F–G). Although vaccine-induced responses may persist, pregnancy-associated immune remodelling exerts a stronger effect. After delivery, monocytes likely shifted towards a restorative state and emphasised immune regulation, metabolism and tissue repair.
T cell characteristics following COVID-19 vaccination in pregnancy
To examine T cell subset changes after COVID-19 vaccination in pregnant donors, T/NK cells were classified into eight subtypes: three CD4+ T cell subsets (CD3D+, CD3E+, CD4+ and CD40LG+), three CD8+ T cell subsets (CD3D+, CD3E+, CD8A+ and CD8B+), one NKT subset (CD3D+, CD3E+ and NKG7+) and one NK subset (NKG7+ and NCAM1+). The CD4+ subsets comprised CD4_Naive_FHIT, CD4_Tcm_AQP3 and CD4_Tem_CXCL8; the CD8+ subsets included CD8_Naive_LINC02446, CD8_Naive_S100B and CD8_Teff_GZMK (Figs. 4A, B and S3A, B). The UMAP plot showed expression patterns of key genes (CD4, CD8A, CD8B, CCR7, NKG7, GZMK, GNLY and GZMA) across subsets (Fig. 4C). Analysis of T cell composition over time revealed that T/NK cell proportions remained stable after the first vaccine dose (T2 and T3; Figs. 4D and S3D). According to previous studies, after SARS-CoV-2 mRNA vaccination, naive T cells gradually differentiated into Tcm and Tem subsets, and CD4⁺ Tcm is recognised as the primary source of long-term immunological memory [9]. Analysis of T cell composition over time revealed that T/NK cell proportions remained stable after the first vaccine dose (T2 and T3; Figs. 4D and S3D). Consistent with previous studies, naive T cells differentiated into Tcm and Tem subsets, and CD4⁺ Tcm served as a major source of long-term memory. Although changes in CD4_Tcm_AQP3 (increased) and CD4_Naive_FHIT (decreased) were not statistically significant, the trend aligns with reported postvaccination differentiation dynamics. Functional activity assessed by GSVA showed that except for quiescent CD4_Naive_FHIT, all other subsets (CD4_Tcm_AQP3, CD4_Tem_CXCL8, CD8_Naive_LINC02446 and CD8_Naive_S100B) exhibited activation of pathways such as dendritic cell dendrite assembly, CCL19/21 signalling and lymphoid lineage migration. NK, NKT and CD8_Teff_GZMK subsets were enriched in immune and eosinophil activation pathways. Notably, NK and NKT cells also showed upregulation of killer-cell immunoglobulin-like receptor and MHC class Ib inhibitory receptor pathways, which suggest regulatory cytotoxic and antigen-recognition potential.
Fig. 4: Changes in T cell and NK cell subsets after COVID-19 vaccination during pregnancy.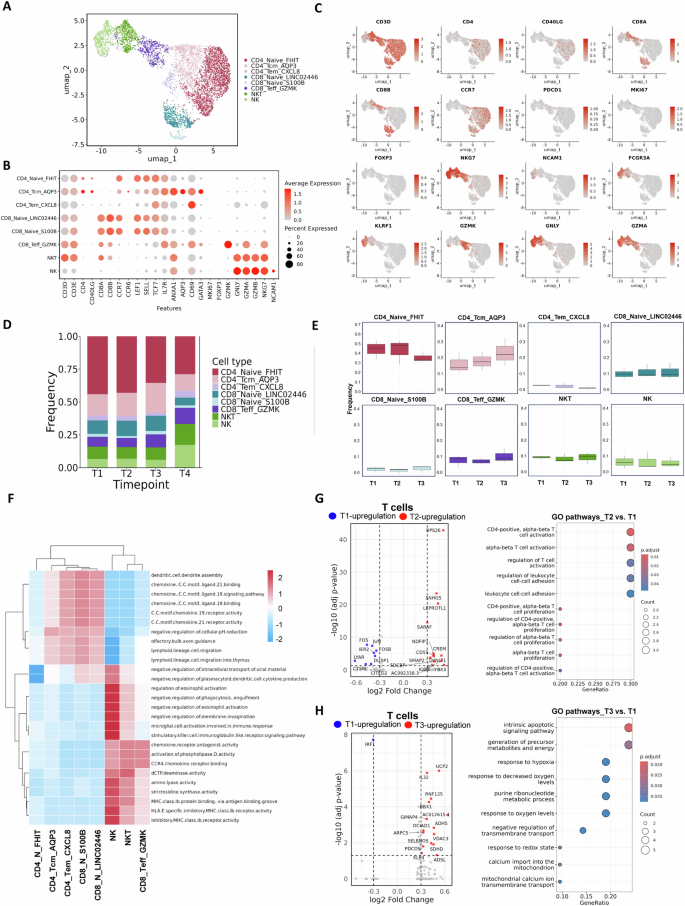
A UMAP visualisation of T cell and NK cell subsets from PBMCs across all timepoints. B Dot plot showing the expression of key marker genes for T cell and NK cell subsets. C UMAP plots displaying representative genes for T cell and NK cell populations. Markers include pan-T cell (CD3D), CD4⁺ T cell (CD4 and CD40LG), CD8⁺ T cell (CD8A and CD8B), memory/naive T cell (CCR7), regulatory T cell (FOXP3), proliferation (MKI67), exhaustion (PDCD1), NK cell (NKG7, NCAM1, FCGR3A and KLRF1) and effector cytotoxic markers (GZMK, GNLY and GZMA). D Bar plot showing the average proportion of each subset across all timepoints. E Box plots quantifying the proportions of all subsets across timepoints. F GSVA showing differences in pathway activity amongst T cell and NK cell subsets. G Volcano plot and GO enrichment analysis of DEGs in all T cells comparing T2 with T1. H Volcano plot and GO enrichment analysis of DEGs in all T cells comparing T3 with T1.
To examine functional changes in T cells further, DEGs and enriched Gene Ontology (GO) pathways at T2 and T3 were analysed and compared with T1 (Fig. 4G and H). In the T2 versus T1 comparison, several genes involved in T cell activation and metabolism (e.g. RPS26, LEPROTL1, CREM and ICOS) were significantly upregulated, along with enrichment of pathways related to CD4-positive alpha–beta T cell activation, T cell proliferation and leukocyte adhesion. These results suggest that shortly after vaccination, T cells undergo robust activation and initiation of immune responses, primarily driven by CD4⁺ T cells. At T3, T cells displayed a distinct transcriptional profile enriched for pathways associated with apoptosis, energy metabolism, redox regulation and mitochondrial activity. Collectively, these findings indicate that even during pregnancy, mRNA vaccination effectively induces T cell activation and differentiation, and T cells gradually transition into functionally mature or memory-maintaining states over time.
Compared with the DEGs identified before delivery (T2 versus T1 and T3 versus T1), the T3 versus T4 comparison revealed more DEGs. Because T4 represents the stage after the second vaccination and delivery, these immune alterations likely reflect combined effects. Besides increases in CD4_Tem_CXCL8 and cytotoxic subsets (NK, NKT and CD8_Teff_GZMK), most T cell subsets declined in proportion, and CD4_Tem_CXCL8 reached statistical significance (Fig. S3D). At the transcriptional level, T3 and T4 T cells showed distinct expression profiles (Fig. S3E). GO enrichment analysis indicated that T3 cells were enriched in T cell differentiation, RNA splicing and lymphocyte differentiation pathways and reflected higher activation than T4. By contrast, T4 cells were enriched in aerobic respiration, mitochondrial metabolism, oxidative phosphorylation and ATP synthesis, which suggested a metabolic shift towards greater energy demand, possibly compensating for the immunosuppressive state of pregnancy (Fig. S3F).
Changes in B cell following COVID-19 vaccination during pregnancy
B cells play a central role in vaccine-induced immunity by mediating humoral responses and establishing immune memory. In our analysis, B cells were regrouped into four clusters and classified into three main subtypes based on canonical markers: Naive_B, Memory_B_GRP183 and Memory_B_ITGB1 (Figs. 5A, B and S4A–B). UMAP visualisation revealed subtype-specific expression: Naive B cells expressed TCL1A, IGHD and MEF2C; memory B cells expressed CD27 and TNFRSF13B; and XBP1 marking plasma cell differentiation, although no plasma cells were detected (Fig. 5C). Composition analysis showed that B cell subset proportions remained stable across T1–T3 (Figs. 5D, E and S4C). To explore functional heterogeneity, GSVA was performed and showed that Naive B cells displayed low activity across most pathways, except modest enrichment in IgM complex and low-affinity IgE receptor genes. By contrast, Memory_B_ITGB1 was enriched in pathways related to lipid metabolism and immune regulation (e.g. PCSK9–AnxA2 complex and glucocorticoid catabolic process), TLR1/TLR2 signalling and cellular migration (uropod and trailing edge membranes). Memory_B_GRP183 showed similar but slightly weaker activation (Fig. 5F).
Fig. 5: Transcriptional and compositional changes in B cell subsets after COVID-19 vaccination during pregnancy.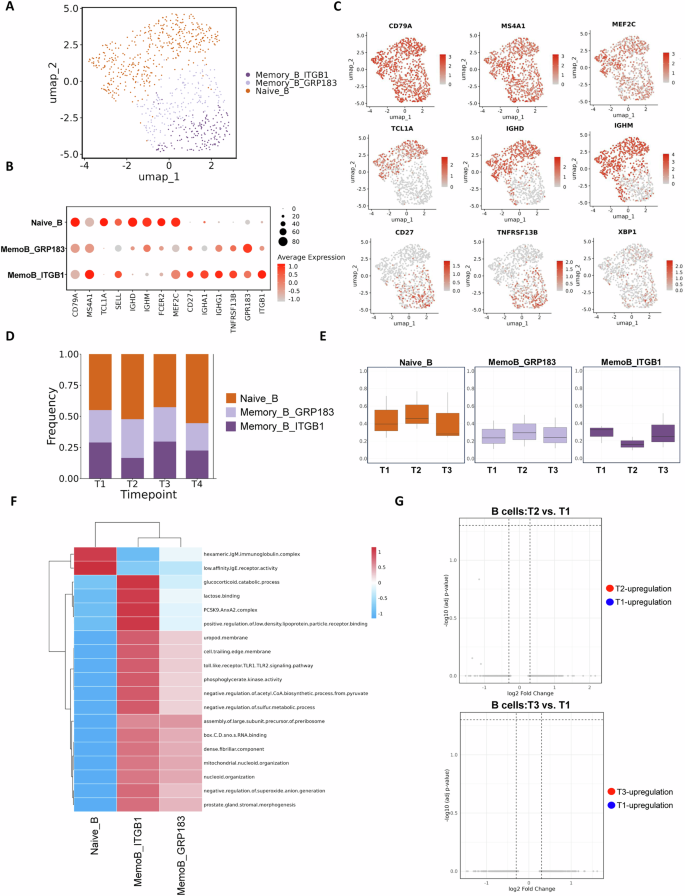
A UMAP showing B cell subsets across all timepoints. B Dot plot of marker gene expression in each B cell subset. C UMAP plots showing the expression of key B cell–related genes, including canonical markers (CD79A and MS4A1), transcription factors (MEF2C and XBP1), activation/proliferation markers (TCF4, CD27 and TNFRSF13B) and immunoglobulin genes (IGHG1, IGHM and IGHD). D Bar plot showing the proportion of each B cell subset over time. E Box plots showing changes in subset frequency. F Heatmap showing GSVA pathway differences between B cell subsets. G Volcano plots showing DEGs in B cells comparing T2 versus T1 (top) and T3 versus T1 (bottom).
Unlike monocytes and T cells, which exhibited transcriptional changes as early as T2, B cells showed no significant DEGs at T2 or T3 (Fig. 5G). This result aligns with antibody data showing major increases in anti–SARS-CoV-2 IgG only after the second vaccine dose, which suggested minimal B cell response after the first dose. Comparison of T3 versus T4 reflected the effects of delivery and the second dose and showed minor but nonsignificant shifts in B cell subset proportions (Fig. S4D). DEG and GO analyses of memory B cells revealed T3 enrichment in oxidative stress and metabolic pathways (e.g. response to hydrogen peroxide and reactive oxygen species), which suggested a primed effector state. By T4, memory B cells exhibited reduced transcriptional activity and likely reflected postdelivery recovery (Figs. S4E, F).


