
 After Strong 1 Year Share Price Gain")
If you are wondering whether Sally Beauty Holdings’ share price still offers value at recent levels, this article walks through what the current market price might be implying about the business. The stock last closed at US$16.55, with returns of 8.8% over the past 7 days, 14.2% over the past month and year to date, and 55.3% over the past year. The 3 year and 5 year returns sit at negative 5.6% and 6.2% respectively, which gives a mixed picture for anyone looking at timing. Recent attention on Sally Beauty Holdings has been shaped by broader interest in specialty retail stocks and how investors think about companies that focus on beauty and personal care. This context helps explain why some investors are reassessing the balance between the company’s risks and its potential rewards. On Simply Wall St’s valuation checks, Sally Beauty Holdings scores 5 out of 6 for being assessed as undervalued. This sets up a closer look at different valuation methods next, followed by a simple framework at the end of the article that can help you make more sense of these valuation signals.
Approach 1: Sally Beauty Holdings Discounted Cash Flow (DCF) Analysis
A Discounted Cash Flow, or DCF, model estimates what a company could be worth today by projecting its future cash flows and then discounting those back to a present value. For Sally Beauty Holdings, the model used is a 2 Stage Free Cash Flow to Equity approach, which looks at near term forecasts followed by a longer term phase.
The latest twelve month Free Cash Flow is about $177.2 million, and Simply Wall St projects Free Cash Flow of $142 million for the year to 30 September 2024, with further yearly projections out to 2035. For example, the 2035 Free Cash Flow estimate is $272.1 million, with intermediate years such as 2026 at $189.1 million and 2030 at $228.2 million, all expressed in dollars and discounted back to today using the DCF method.
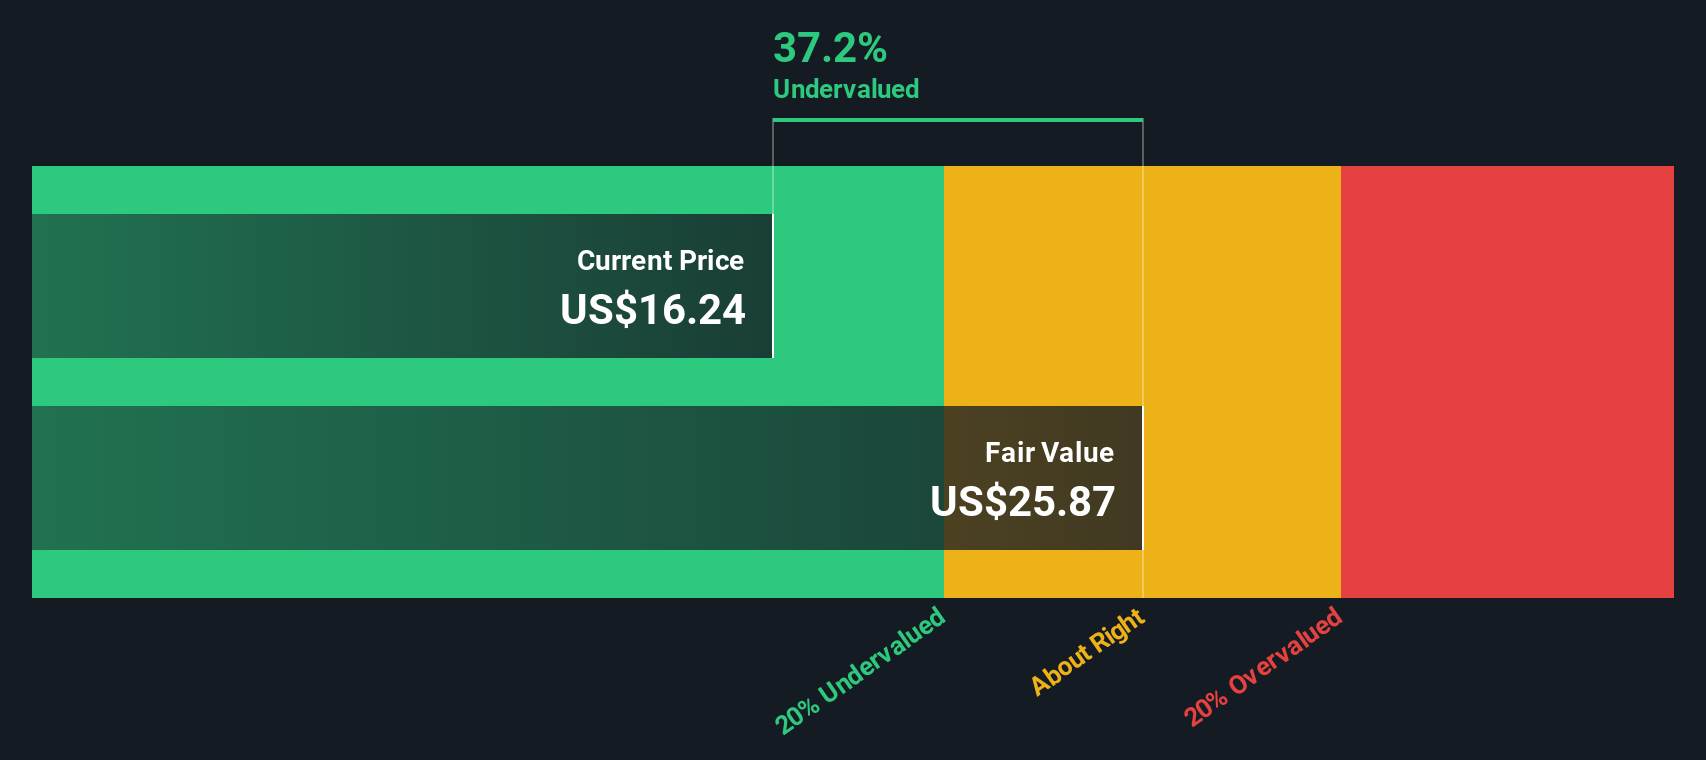
Combining those cash flows, the model arrives at an estimated intrinsic value of about $26.18 per share. Compared with the recent share price of $16.55, this suggests the stock is around 36.8% undervalued based on these assumptions.
Result: UNDERVALUED
Our Discounted Cash Flow (DCF) analysis suggests Sally Beauty Holdings is undervalued by 36.8%. Track this in your watchlist or portfolio, or discover 869 more undervalued stocks based on cash flows.
 SBH Discounted Cash Flow as at Feb 2026
Approach 2: Sally Beauty Holdings Price vs Earnings
For a profitable business like Sally Beauty Holdings, the P/E ratio is a useful way to think about what you are paying for each dollar of earnings. Higher growth expectations or lower perceived risk can justify a higher P/E, while slower growth or higher risk usually point to a lower “normal” or “fair” P/E range.
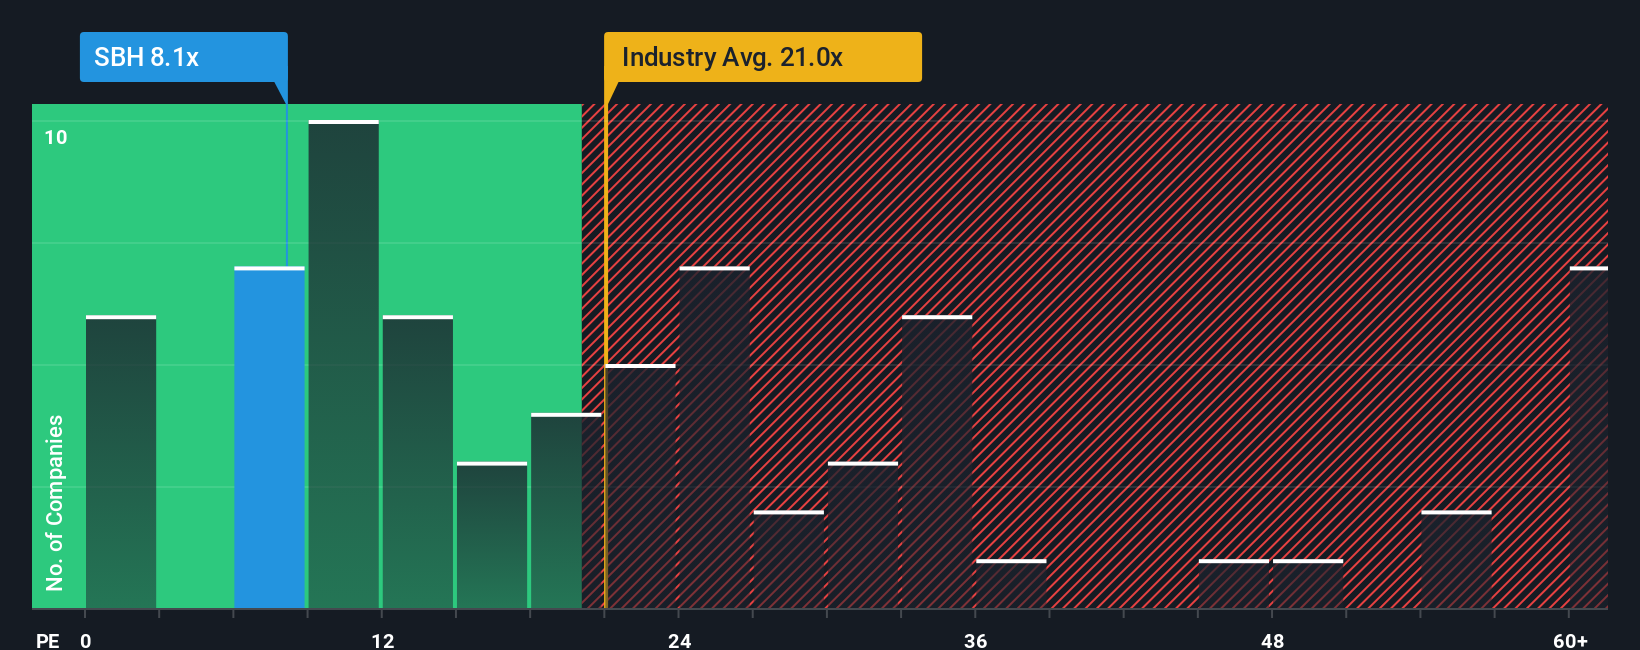
Sally Beauty Holdings currently trades on a P/E of 8.24x. That sits well below the Specialty Retail industry average P/E of 20.95x and the peer group average of 18.73x, which suggests the market prices its earnings at a discount to many other companies in the space.
Simply Wall St’s Fair Ratio for Sally Beauty Holdings is 12.98x. This is a proprietary estimate of the P/E that might be reasonable given factors such as the company’s earnings growth profile, profit margins, industry, market cap and specific risks. Because it adjusts for these company level traits, the Fair Ratio can be more tailored than a simple comparison with peers or the broad industry. With the current P/E of 8.24x below the Fair Ratio of 12.98x, the stock appears undervalued on this metric.
Result: UNDERVALUED
 NYSE:SBH P/E Ratio as at Feb 2026
P/E ratios tell one story, but what if the real opportunity lies elsewhere? Discover 1423 companies where insiders are betting big on explosive growth.
Upgrade Your Decision Making: Choose your Sally Beauty Holdings Narrative
Earlier we mentioned that there is an even better way to understand valuation, so let us introduce you to Narratives, which are simply your story about Sally Beauty Holdings linked directly to the numbers you think are reasonable for its future revenue, earnings, margins and fair value.
On Simply Wall St, within the Community page used by millions of investors, a Narrative connects your view of the business to a financial forecast and then to a fair value estimate. This allows you to quickly compare that fair value with the current share price and decide whether the gap is large enough for you to consider buying or selling.
Narratives are also kept up to date. When new information such as company news or earnings is added, the forecasts and fair values that sit behind each Narrative are refreshed so your story about Sally Beauty Holdings stays aligned with the latest data rather than going stale.
For example, one Sally Beauty Holdings Narrative on Simply Wall St might assume a relatively low fair value with modest revenue growth and thinner profit margins. Another might assume a higher fair value backed by stronger revenue expansion and more robust margins. This shows how two investors can look at the same company and reach very different conclusions using the same tool.
Do you think there’s more to the story for Sally Beauty Holdings? Head over to our Community to see what others are saying!
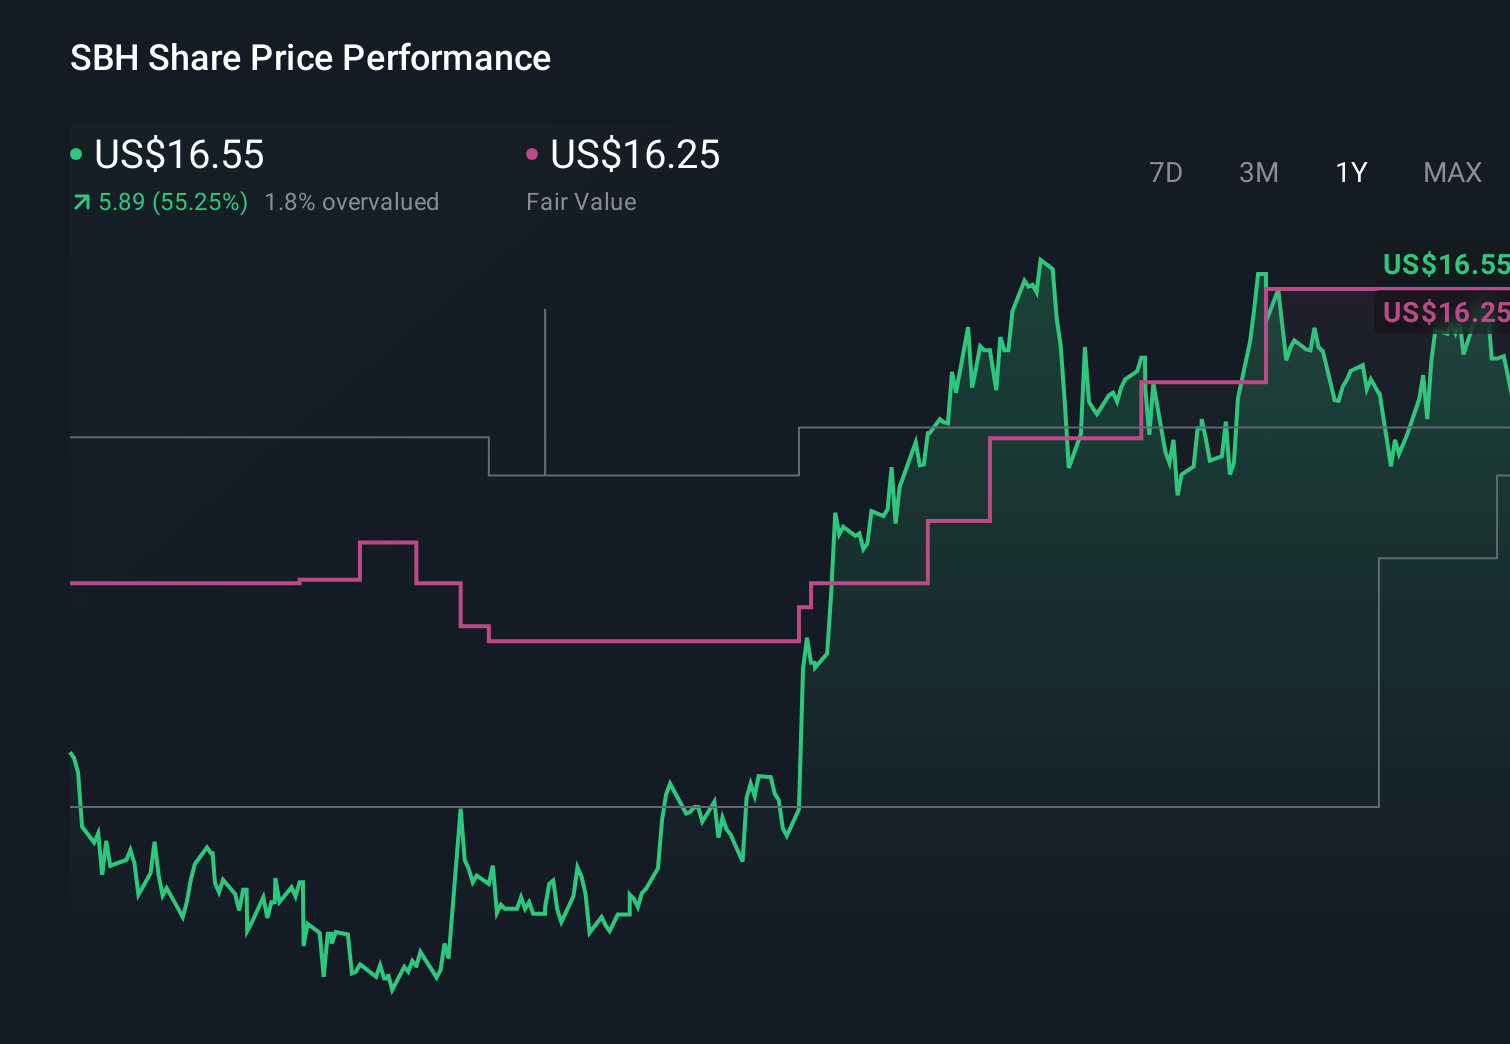 NYSE:SBH 1-Year Stock Price Chart
This article by Simply Wall St is general in nature. We provide commentary based on historical data
and analyst forecasts only using an unbiased methodology and our articles are not intended to be financial advice. It does not constitute a recommendation to buy or sell any stock, and does not take account of your objectives, or your
financial situation. We aim to bring you long-term focused analysis driven by fundamental data.
Note that our analysis may not factor in the latest price-sensitive company announcements or qualitative material.
Simply Wall St has no position in any stocks mentioned.
New: Manage All Your Stock Portfolios in One Place
We’ve created the ultimate portfolio companion for stock investors, and it’s free.
• Connect an unlimited number of Portfolios and see your total in one currency
• Be alerted to new Warning Signs or Risks via email or mobile
• Track the Fair Value of your stocks
Have feedback on this article? Concerned about the content? Get in touch with us directly. Alternatively, email editorial-team@simplywallst.com


