

Feb 6, 2026
IndexBox has just published a new report: GCC – Gym and Fitness Equipment – Market Analysis, Forecast, Size, Trends and Insights.
The article provides a comprehensive analysis of the GCC gym and fitness equipment market from 2013 to 2024, with forecasts to 2035. It details market performance in volume (tons) and value (USD), highlighting a recovery in 2024 after a two-year decline. Key insights include Saudi Arabia’s dominance in consumption and imports, Kuwait’s role as the only regional producer, and Bahrain’s high growth rates. The analysis covers consumption, production, import, and export trends by country, including per capita figures and price dynamics. The market is projected to grow steadily, with a forecasted CAGR of +3.1% in volume and +4.3% in value through 2035.
Key Findings
GCC market is forecast to grow to 79K tons and $442M by 2035Saudi Arabia is the largest consumer and importer, accounting for over half of total volumeKuwait is the sole producer within the GCC, with output surging to 5.2K tons in 2024Bahrain shows the highest growth rates in both consumption value and import valueImport prices fell sharply in 2024, with significant price disparities between countries like Bahrain and Saudi ArabiaMarket Forecast
Driven by increasing demand for gym and fitness equipment in GCC, the market is expected to continue an upward consumption trend over the next decade. Market performance is forecast to retain its current trend pattern, expanding with an anticipated CAGR of +3.1% for the period from 2024 to 2035, which is projected to bring the market volume to 79K tons by the end of 2035.
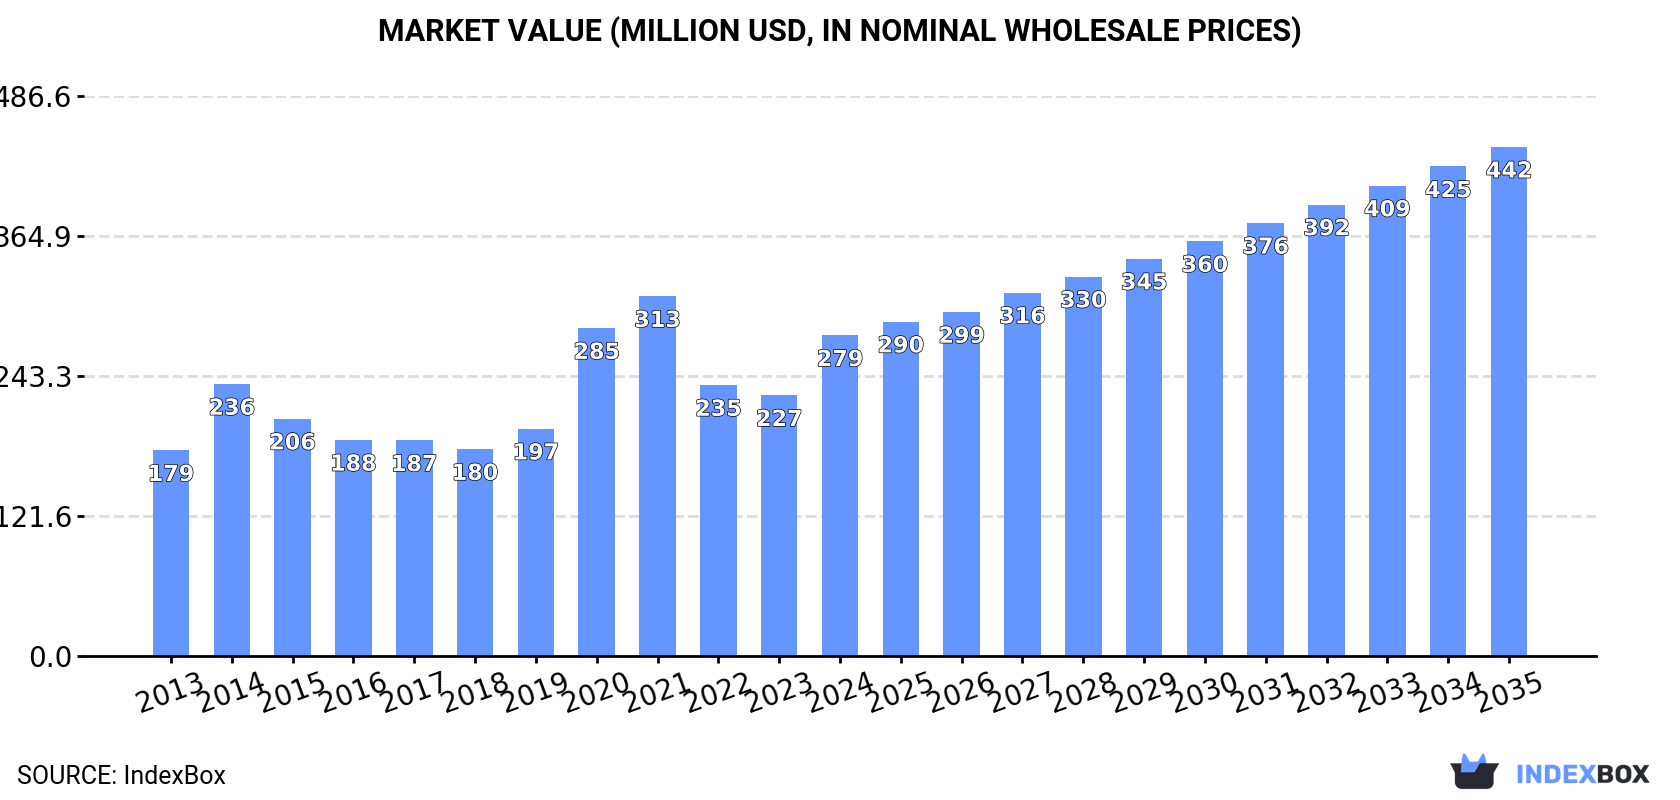
In value terms, the market is forecast to increase with an anticipated CAGR of +4.3% for the period from 2024 to 2035, which is projected to bring the market value to $442M (in nominal wholesale prices) by the end of 2035.
 ConsumptionGCC’s Consumption of Gym and Fitness Equipment
In 2024, consumption of gym and fitness equipment was finally on the rise to reach 56K tons after two years of decline. The total consumption indicated measured growth from 2013 to 2024: its volume increased at an average annual rate of +3.3% over the last eleven-year period. The trend pattern, however, indicated some noticeable fluctuations being recorded throughout the analyzed period. The volume of consumption peaked at 68K tons in 2021; however, from 2022 to 2024, consumption remained at a lower figure.
The size of the gym and fitness equipment market in GCC surged to $279M in 2024, growing by 23% against the previous year. This figure reflects the total revenues of producers and importers (excluding logistics costs, retail marketing costs, and retailers’ margins, which will be included in the final consumer price). The total consumption indicated a pronounced increase from 2013 to 2024: its value increased at an average annual rate of +4.1% over the last eleven years. The trend pattern, however, indicated some noticeable fluctuations being recorded throughout the analyzed period. The level of consumption peaked at $313M in 2021; however, from 2022 to 2024, consumption failed to regain momentum.
Consumption By Country
The countries with the highest volumes of consumption in 2024 were Saudi Arabia (29K tons), the United Arab Emirates (16K tons) and Kuwait (6.6K tons), with a combined 92% share of total consumption. Qatar, Bahrain and Oman lagged somewhat behind, together accounting for a further 8.5%.
From 2013 to 2024, the biggest increases were recorded for Bahrain (with a CAGR of +8.4%), while consumption for the other leaders experienced more modest paces of growth.
In value terms, Saudi Arabia ($124M), the United Arab Emirates ($96M) and Kuwait ($21M) constituted the countries with the highest levels of market value in 2024, together accounting for 86% of the total market. Qatar, Bahrain and Oman lagged somewhat behind, together comprising a further 14%.
In terms of the main consuming countries, Bahrain, with a CAGR of +11.8%, recorded the highest rates of growth with regard to market size over the period under review, while market for the other leaders experienced more modest paces of growth.
The countries with the highest levels of gym and fitness equipment per capita consumption in 2024 were the United Arab Emirates (1,579 kg per 1000 persons), Kuwait (1,466 kg per 1000 persons) and Qatar (874 kg per 1000 persons).
From 2013 to 2024, the biggest increases were recorded for Bahrain (with a CAGR of +5.2%), while consumption for the other leaders experienced more modest paces of growth.
ProductionGCC’s Production of Gym and Fitness Equipment
Gym and fitness equipment production surged to 5.2K tons in 2024, increasing by 17% compared with 2023. Over the period under review, production recorded a prominent expansion. The most prominent rate of growth was recorded in 2014 with an increase of 28% against the previous year. The volume of production peaked in 2024 and is likely to continue growth in years to come.
In value terms, gym and fitness equipment production surged to $53M in 2024 estimated in export price. Overall, production continues to indicate a significant expansion. The growth pace was the most rapid in 2014 with an increase of 92%. Over the period under review, production reached the peak level in 2024 and is likely to continue growth in the immediate term.
Production By Country
Kuwait (5.2K tons) remains the largest gym and fitness equipment producing country in GCC, accounting for 100% of total volume.
From 2013 to 2024, the average annual rate of growth in terms of volume in Kuwait amounted to +9.1%.
ImportsGCC’s Imports of Gym and Fitness Equipment
In 2024, overseas purchases of gym and fitness equipment were finally on the rise to reach 53K tons after two years of decline. Total imports indicated a temperate expansion from 2013 to 2024: its volume increased at an average annual rate of +2.7% over the last eleven-year period. The trend pattern, however, indicated some noticeable fluctuations being recorded throughout the analyzed period. The growth pace was the most rapid in 2020 with an increase of 74% against the previous year. Over the period under review, imports reached the peak figure at 66K tons in 2021; however, from 2022 to 2024, imports remained at a lower figure.
In value terms, gym and fitness equipment imports rose significantly to $297M in 2024. Total imports indicated a temperate expansion from 2013 to 2024: its value increased at an average annual rate of +4.8% over the last eleven-year period. The trend pattern, however, indicated some noticeable fluctuations being recorded throughout the analyzed period. Based on 2024 figures, imports increased by +14.5% against 2022 indices. The most prominent rate of growth was recorded in 2020 when imports increased by 34%. The level of import peaked at $311M in 2021; however, from 2022 to 2024, imports stood at a somewhat lower figure.
Imports By Country
Saudi Arabia was the main importing country with an import of around 29K tons, which finished at 55% of total imports. The United Arab Emirates (18K tons) took the second position in the ranking, distantly followed by Qatar (2.7K tons). All these countries together held near 38% share of total imports. Kuwait (1.4K tons), Bahrain (1.2K tons) and Oman (0.9K tons) followed a long way behind the leaders.
From 2013 to 2024, the biggest increases were recorded for Bahrain (with a CAGR of +7.2%), while purchases for the other leaders experienced more modest paces of growth.
In value terms, the largest gym and fitness equipment importing markets in GCC were Saudi Arabia ($126M), the United Arab Emirates ($113M) and Qatar ($21M), with a combined 88% share of total imports. Kuwait, Bahrain and Oman lagged somewhat behind, together comprising a further 12%.
Bahrain, with a CAGR of +12.7%, saw the highest growth rate of the value of imports, in terms of the main importing countries over the period under review, while purchases for the other leaders experienced more modest paces of growth.
Import Prices By Country
The import price in GCC stood at $5,643 per ton in 2024, reducing by -25.4% against the previous year. Import price indicated a moderate expansion from 2013 to 2024: its price increased at an average annual rate of +2.1% over the last eleven years. The trend pattern, however, indicated some noticeable fluctuations being recorded throughout the analyzed period. The most prominent rate of growth was recorded in 2022 when the import price increased by 32% against the previous year. The level of import peaked at $7,564 per ton in 2023, and then contracted sharply in the following year.
There were significant differences in the average prices amongst the major importing countries. In 2024, amid the top importers, the country with the highest price was Bahrain ($11,247 per ton), while Saudi Arabia ($4,372 per ton) was amongst the lowest.
From 2013 to 2024, the most notable rate of growth in terms of prices was attained by Oman (+9.0%), while the other leaders experienced more modest paces of growth.
ExportsGCC’s Exports of Gym and Fitness Equipment
In 2024, overseas shipments of gym and fitness equipment increased by 3.3% to 1.6K tons for the first time since 2021, thus ending a two-year declining trend. In general, exports, however, continue to indicate a noticeable setback. The most prominent rate of growth was recorded in 2017 with an increase of 96%. The volume of export peaked at 2.7K tons in 2021; however, from 2022 to 2024, the exports stood at a somewhat lower figure.
In value terms, gym and fitness equipment exports dropped to $7.8M in 2024. Over the period under review, exports enjoyed a perceptible expansion. The most prominent rate of growth was recorded in 2017 when exports increased by 102% against the previous year. The level of export peaked at $15M in 2018; however, from 2019 to 2024, the exports remained at a lower figure.
Exports By Country
The United Arab Emirates dominates exports structure, finishing at 1.4K tons, which was near 87% of total exports in 2024. It was distantly followed by Saudi Arabia (142 tons), making up an 8.9% share of total exports. Kuwait (37 tons) took a relatively small share of total exports.
Exports from the United Arab Emirates decreased at an average annual rate of -1.9% from 2013 to 2024. At the same time, Saudi Arabia (+27.3%) displayed positive paces of growth. Moreover, Saudi Arabia emerged as the fastest-growing exporter exported in GCC, with a CAGR of +27.3% from 2013-2024. By contrast, Kuwait (-12.6%) illustrated a downward trend over the same period. While the share of Saudi Arabia (+8.4 p.p.) and the United Arab Emirates (+1.8 p.p.) increased significantly in terms of the total exports from 2013-2024, the share of Kuwait (-5.8 p.p.) displayed negative dynamics.
In value terms, the United Arab Emirates ($6.6M) remains the largest gym and fitness equipment supplier in GCC, comprising 84% of total exports. The second position in the ranking was taken by Saudi Arabia ($632K), with an 8.1% share of total exports.
In the United Arab Emirates, gym and fitness equipment exports expanded at an average annual rate of +4.2% over the period from 2013-2024. In the other countries, the average annual rates were as follows: Saudi Arabia (+21.0% per year) and Kuwait (-3.0% per year).
Export Prices By Country
In 2024, the export price in GCC amounted to $4,893 per ton, dropping by -16.1% against the previous year. Over the period under review, the export price, however, showed a resilient expansion. The growth pace was the most rapid in 2018 an increase of 54% against the previous year. As a result, the export price reached the peak level of $6,926 per ton. From 2019 to 2024, the export prices failed to regain momentum.
There were significant differences in the average prices amongst the major exporting countries. In 2024, amid the top suppliers, the country with the highest price was Kuwait ($10,058 per ton), while Saudi Arabia ($4,447 per ton) was amongst the lowest.
From 2013 to 2024, the most notable rate of growth in terms of prices was attained by Kuwait (+10.9%), while the other leaders experienced mixed trends in the export price figures.
Source: IndexBox Market Intelligence Platform
This report provides a comprehensive view of the gym and fitness equipment industry in GCC, tracking demand, supply, and trade flows across the regional value chain. It explains how demand across key channels and end-use segments shapes consumption patterns, while also mapping the role of input availability, production efficiency, and regulatory standards on supply.
Beyond headline metrics, the study benchmarks prices, margins, and trade routes so you can see where value is created and how it moves between exporters and importers within GCC. The analysis is designed to support strategic planning, market entry, portfolio prioritization, and risk management in the gym and fitness equipment landscape in GCC.
Quick navigation
Key findings
Regional demand is shaped by both household and industrial usage, with trade flows linking supply hubs to import-reliant countries.
Pricing dynamics reflect unit values, freight costs, exchange rates, and regulatory shifts that affect sourcing decisions.
Supply depends on input availability and production efficiency, creating distinct cost curves across GCC.
Market concentration varies by country, creating different competitive landscapes and entry barriers.
The 2035 outlook highlights where capacity investment and demand growth are most aligned within the region.
Report scope
The report combines market sizing with trade intelligence and price analytics for GCC. It covers both historical performance and the forward outlook to 2035, allowing you to compare cycles, structural shifts, and policy impacts across countries and sub-regions.
Market size and growth in value and volume terms
Consumption structure by end-use segments and countries
Production capacity, output, and cost dynamics
Regional trade flows, exporters, importers, and balances
Price benchmarks, unit values, and margin signals
Competitive context and market entry conditions
Product coverageProdcom 32301400 – Gymnasium or athletics articles and equipmentCountry coverageCountry profiles and benchmarks
For the regional report, country profiles provide a consistent view of market size, trade balance, prices, and per-capita indicators across GCC. The profiles highlight the largest consuming and producing markets and allow direct benchmarking across peers.
Methodology
The analysis is built on a multi-source framework that combines official statistics, trade records, company disclosures, and expert validation. Data are standardized, reconciled, and cross-checked to ensure consistency across time series.
International trade data (exports, imports, and mirror statistics)
National production and consumption statistics
Company-level information from financial filings and public releases
Price series and unit value benchmarks
Analyst review, outlier checks, and time-series validation
All data are normalized to a common product definition and mapped to a consistent set of codes. This ensures that comparisons across time are aligned and actionable.
Forecasts to 2035
The forecast horizon extends to 2035 and is based on a structured model that links gym and fitness equipment demand and supply to macroeconomic indicators, trade patterns, and sector-specific drivers. The model captures both cyclical and structural factors and reflects known policy and technology shifts within GCC.
Historical baseline: 2012-2025
Forecast horizon: 2026-2035
Scenario-based sensitivity to income growth, substitution, and regulation
Capacity and investment outlook for major producing countries
Each country projection is built from its own historical pattern and the regional context, allowing the report to show where growth is concentrated and where risks are elevated.
Price analysis and trade dynamics
Prices are analyzed in detail, including export and import unit values, regional spreads, and changes in trade costs. The report highlights how seasonality, freight rates, exchange rates, and supply disruptions influence pricing and margins.
Price benchmarks by country and sub-region
Export and import unit value trends
Seasonality and calendar effects in trade flows
Price outlook to 2035 under baseline assumptions
Profiles of market participants
Key producers, exporters, and distributors are profiled with a focus on their operational scale, geographic footprint, product mix, and market positioning. This helps identify competitive pressure points, partnership opportunities, and routes to differentiation.
Business focus and production capabilities
Geographic reach and distribution networks
Cost structure and pricing strategy indicators
Compliance, certification, and sustainability context
How to use this report
Quantify regional demand and identify the most attractive country markets
Evaluate export opportunities and prioritize target destinations
Track price dynamics and protect margins
Benchmark performance against regional competitors
Build evidence-based forecasts for investment decisions
This report is designed for manufacturers, distributors, importers, wholesalers, investors, and advisors who need a clear, data-driven picture of gym and fitness equipment dynamics in GCC.
FAQ
What is included in the gym and fitness equipment market in GCC?
The market size aggregates consumption and trade data at country and sub-regional levels, presented in both value and volume terms.
How are the forecasts to 2035 built?
The projections combine historical trends with macroeconomic indicators, trade dynamics, and sector-specific drivers.
Does the report cover prices and margins?
Yes, it includes export and import unit values, regional spreads, and a pricing outlook to 2035.
Which countries are profiled in detail?
The report provides profiles for the largest consuming and producing countries in GCC.
Can this report support market entry decisions?
Yes, it highlights demand hotspots, trade routes, pricing trends, and competitive context.


