
")
Patient characteristics and cohort selection
Two tissue microarrays (TMAs) were constructed from independent cohorts from NSCLC patient tumors presenting clinically between 2011–2017 (YTMA404) and 2017–2019 (YTMA471). TMA slides were run in parallel and subjected to multiplex (44-plex) tissue staining (Fig. 1a). Cohort metadata prior to sample refinement consisted of eighty-two patients with available clinical annotations shown (Fig. 1b). RECIST best overall response (BOR) information was available for seventy-seven patients, consisting of twenty-nine with progressive disease (PD), twenty-six with stable disease (SD), seventeen with partial response (PR), and five with complete response (CR). Samples from non-primary lung tissues were removed (n = 10 lymph node, n = 2 bowel, n = 4 brain, n = 1 spinal, n = 1 skin), and only specimens taken pre-ICI treatment were considered for analysis (Fig. 1d). The final cohorts consisted of fifty-five patients with twenty-five females and thirty males. Smoking status varied with five being current smokers, forty-five former smokers, and five never smokers. The sampled histologies comprised 36 adenocarcinomas, 17 squamous cell carcinomas, and 2 adenosquamous carcinomas, with varying disease stages at time of diagnosis between stage II (n = 5), stage III (n = 6), and stage IV (n = 44). ICI treatment was given in the advanced stage setting. The mean patient age was 67.1 years (±10.3 years) (Fig. 1b). Either objective response (partial or complete) or progression free survival above 6 months was used as the primary endpoint to group patients who received clinical benefit beyond 6 months post treatment (CB6 = yes, n = 46) vs those who progressed within 6 months (CB6 = no, n = 34) (Fig. 1e). This definition allowed both the clinically meaningful grouping of advanced stage disease management as well as overcoming the ambiguity in assessing practical responses for those patients with RECIST stable disease.
Fig. 1: Clinical characteristics and experimental design.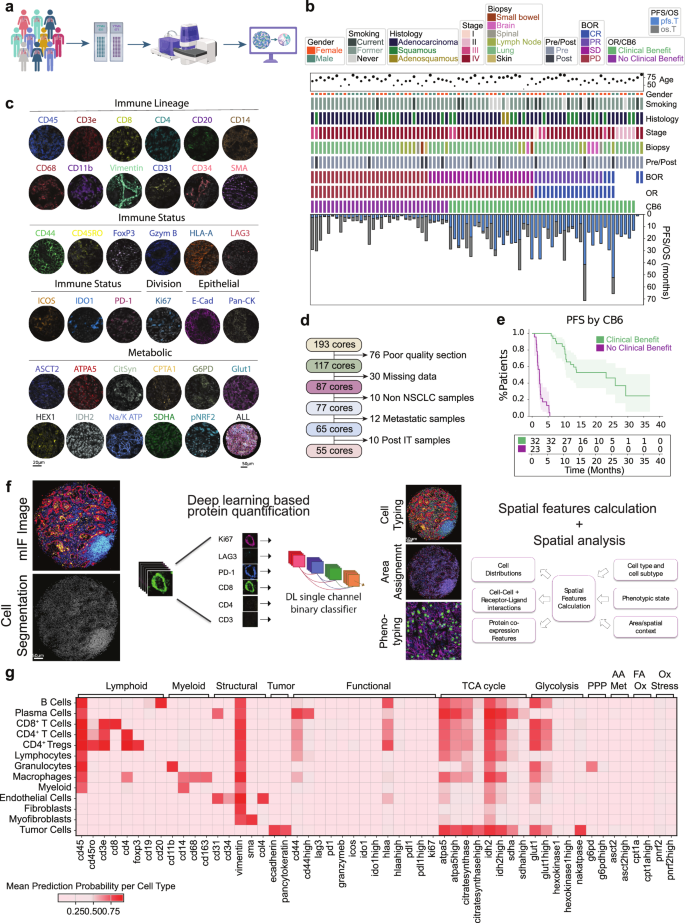
a Sample acquisition workflow. TMA generation and processing on the PhenoCycler™-Fusion system. Graphics created in Biorender. b Clinical information for processed patient samples outlining age, gender, smoking status, histology type, tumor stage (I, II, III, IV), biopsy site, sampled pre or post immunotherapy treatment, best overall response (BOR) (divided into complete response (CR), partial response (PR), stable disease (SD) and progressive disease (PD)), overall response (OR), response status at 6 months (CB6), progression free survival (PFS) and overall survival (OS). c Representative images of individual cell marker positivity under the categories ‘Immune Lineage,’ ‘Immune Status,’ ‘Tumor,’ ‘Epithelial,’ and ‘Metabolic.’ d Exclusion criteria for processed samples. e Progression-free survival split by CB6. Data are presented as mean values with 95% confidence intervals. f Nucleai’s deep learning-based cell typing and cell state phenotyping pipeline, with measured features analyzed for clinical endpoints. g Heatmap of cell type specific lineage, functional, and metabolic markers. PPP Pentose Phosphate Pathway, AA Met Amino acid metabolism, FA Ox Fatty acid oxidation, Ox Stress Oxidative stress response. All tests shown are representative of the test cohort, n = 55 (CB6 Yes n = 32, CB6 No n = 23. Source data are provided as a source data file. Created in BioRender. Kulasinghe, A. (2026) https://BioRender.com/bbzp5hk.
Cell phenotyping
Representative images for markers indicative for immune lineage (CD45, CD3e, CD8, CD4, CD20, CD14, CD68, CD11b, Vimentin, CD31, CD34), immune status (CD44, CD45RO, FoxP3, Granzyme B, HLA-A, LAG3, ICOS, IDO1, PD-L1, PD-1), dividing cells (Ki67), epithelial cells (E-cadherin, PanCK) and metabolic status (ASCT2, ATPA5, citrate synthase, CPT1A, G6PD, GLUT1, hexokinase 1, IDH2, NA/K ATPase, pNRF2, SDHA) are shown (Fig.1c). A deep learning cell phenotyping platform developed by Nucleai was used to classify cells (Fig. 1f) according to a rules table shown diagrammatically (Supplementary Fig. 1a) Final defined cell lineages included tumor cells (41.4%), macrophages (14%), myeloid NOS (not otherwise specified) (1.3%), immune NOS (3%), granulocytes (2.5%), B Cells (1.6%), plasma cells (1.7%), CD4+ Tregs (1.9%), CD4+ T cells (8.6%), and CD8+ T cells (4.5%).Cell lineages were then assessed for functional phenotypes (Supplementary Fig. 1b). Overall expression of functional markers are shown per cell type, where metabolic expression patterns predominated in both immune and tumor cells (Fig.1g).
Cell type proportions
The gross cellular makeup of patient tissues was first inspected for cellular frequencies and functional expression patterns. Tumor cell composition ranged from 10% to 90% within the cohorts and isolation of non-tumor cells revealed macrophages and CD4+ T cells to be the predominant immune cells, with significant numbers of fibroblasts and myofibroblasts contributing to the tissue architecture (Fig. 2a). Overall abundance of the functional status of cell types was measured (Fig. 2b), indicating tumor cell expression patterns for functional markers (IDO1, PD-L1, HLA-A, Ki67 and vimentin). Of immune cells, CD4+ T cells indicated positivity for all immune functional markers, while CD4+ Tregs expressed patterns of PD-1 and ICOS positivity. CD8+ T cells demonstrated expression of granzyme B and PD-1, while macrophages showed positivity for all functional markers. Metabolic marker positivity among both tumor and immune cells indicated expression of markers consistent with mitochondrial respiration (oxidative phosphorylation: OXPHOS). Interestingly, both macrophages and tumor cells had high positivity counts for ATPA5, citrate synthase, Glut1, IDH2, and SDHA (Fig. 2b) suggesting high OXPHOS activity and distinct activated metabolic phenotypes in both tumor and innate immune cells.
Fig. 2: Profile of the cell proportions and functional proportions in the data.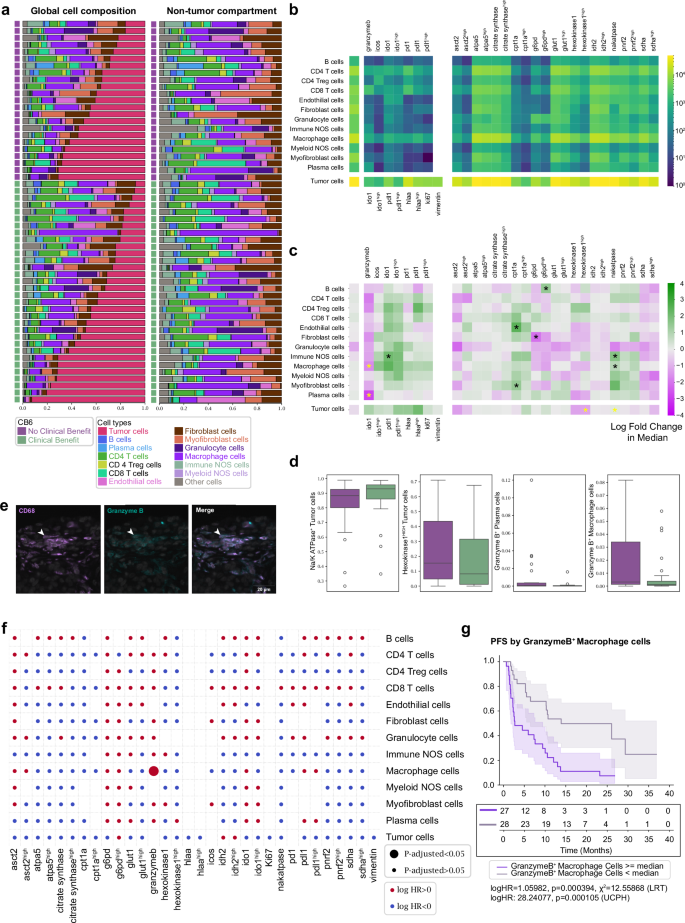
a Cellular composition of tissue cores releveled according to clinical outcome and tumor cell compartment. The immune/stromal compartment is shown separately. 42% of the cohort exhibited no clinical benefit and 58% exhibited clinical benefit. b Heatmap showing cell type specific marker positivity across all samples. c Two sided Mann–Whitney U test showing log-fold 2 changes in base and marker functionalized cell type proportions between patients with (green) and without (purple) clinical benefit. Cell proportion values were normalized to each distinct heatmap block. Significant values (*) are shown, those in yellow are further evaluated in (d) (p < 0.05). Data shown is not adjusted for multiple comparisons. d Barplots of significant values from (c) for CB6 positive (green, n = 32) and CB6 negative (purple, n = 23). Data are presented as median, q1 and q3 range, with 95% percentile shown in whiskers. e Representative images showing CD68+granzyme B+ staining. f Summary of multiple univariate Cox PH tests of functionalized cell type proportions with respect to PFS. Log HR and adjusted P values were binarized and shown as circle colors and sizes. Data shown is not adjusted for multiple comparisons. g Kaplan–Meier curve of PFS by median proportions of granzyme B+ macrophages. Data are presented as mean values with 95% confidence intervals (Log-rank test by median stratification: two-sided Chi-square statistic: 12.6, Unadjusted p value: 0.0004, logHR: 1.06. Univariate Cox PH by continuous proportion values: logHR: 28.2, Unadjusted P value: 0.0001). All tests shown are representative of the test cohort, n = 55 (CB6 Yes n = 32, CB6 No n = 23). Source data are provided as a source data file.
To statistically evaluate these cell type positivity states at the gross tissue level for clinical outcome, we applied Mann–Whitney U tests. Fold-change enrichments were assessed within patient outcome groups: clinical benefit (green) and no clinical benefit (purple). Elevated Na/K ATPase+/IDO1+ immune NOS cells, CPT1a+ endothelial and myofibroblast cells, G6PDHIGH B cells, Na/K ATPase+ macrophage cells, were enriched in patients who received clinical benefit, consistent with an immune environment with a high energy demand. Conversely, Granzyme B+ plasma cells, granzyme B+ macrophages, G6PD+ fibroblast cells, and hexokinase1HIGH tumor cells were elevated in non-clinical benefit patients. Tumor cells positive for amino acid metabolism (ASCT2) and TCA enzymes (SDHA), commonly overexpressed in NSCLC10 and associated with poor prognosis, were elevated in patients who relapsed within 6 months of ICI treatment (Fig. 2c, d).
Examination of all marker positivity features after correcting for multiple testing revealed that only granzyme B+ macrophages were significantly associated with poorer outcomes after ICI treatment (Fig. 2e, f). Assessment of marker positivity for progression-free survival supported the role or the presence of cytotoxic granzyme B+ macrophages in treatment resistance, where higher levels were concomitantly associated with poorer PFS outcomes (Fig. 2g).
Tissue region dissection
Cellular neighborhoods (CNs)11 were used to construct unbiased tissue regions. K-means clustering on the KNN histograms of binary cell types (tumor or non-tumor) allowed tumor/stroma CNs (K = 2) or tumor/stroma/interface (K = 3) CNs to be generated (Fig. 3a, b). The K = 2 CNs were designed to capture tumor/stromal regions, whereas the K = 3 CNs were designed to provide resolution of the interface region between tumor cells and their surrounds, where functional immune cells and metabolic gradients are expected to play a critical role in the clinical response. Cells were assigned within these regions for assessment of spatially resolved frequencies. Overall, within tumor regions, increased plasma cells exhibited a trend towards clinical benefit, while higher granulocyte and CD4+ Treg infiltration appeared to trend negatively with response (Fig. 3c).
Fig. 3: Univariate analysis of cell proportions and marker expression in cellular neighborhoods.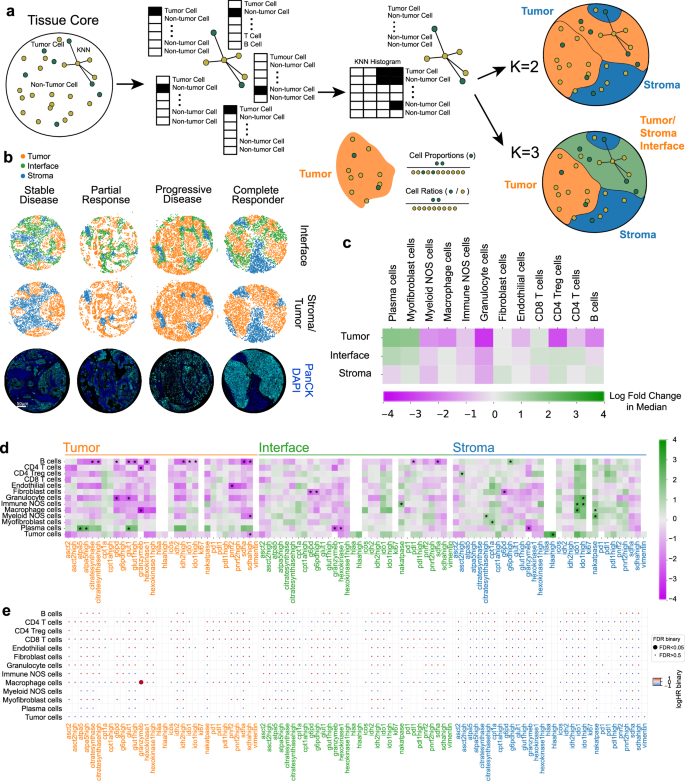
a Cellular neighborhood assignment via k-means clustering on neighborhood cell-type histograms. b Representative cores for stable disease, partial response, progressive disease, and complete responder patients. Each spot represents a cell’s cellular neighborhood annotation. Immunofluorescent images of core positivity for Pan-CK (cyan) and DAPI (blue) are shown to illustrate cellular neighborhood concordance. c Two-sided Mann–Whitney U test showing log-fold 2 changes of cell lineages in cellular neighborhoods. d Two-sided Mann–Whitney U tests showing log-fold 2 changes of functional cell marker expression per cellular neighborhood. e FDR corrected univariate Cox proportional hazards tests of functionalized cell type proportions per cellular neighborhood with respect to PFS. Log HR and adjusted P values were binarized and shown as circle colors and sizes. All tests shown are representative of the test cohort, n = 55 (CB6 yes n = 32, CB6 no n = 23). Source data are provided as a source data file.
Marker positivity for cell types was assessed within our assigned tissue regions (Fig. 3d), where metabolically active B cells in tumor areas associated with worse clinical outcomes. B cell expression of GLUT1HIGH and G6PD/hexokinase1 coupled with Ki67 positivity indicated a highly glycolytic phenotype with concomitant activation of the pentose phosphate pathway known to be active in proliferating cells12. Interestingly, additional levels of citrate synthaseHIGH, IDH2, and SDHA positivity suggested elevated levels of OXPHOS, which coupled with a proliferative phenotype, point to a role for active, expanding B cell populations within tumor regions in ICI refractory disease. The role for activated B cells was further evidenced by elevated levels of IDO1 in tumor regions13. We observed granulocyte expression of G6PD and GLUT1 in tumor regions to be associated with worse clinical outcome and localized the negatively associated granzyme B+ macrophages within the tumor compartment. Conversely, plasma cell expression of OXPHOS enzymes ATPA5 and GLUT1 within tumor regions was beneficial, suggesting an activated state that may influence localized antibody secretion and recognition within the tumor, priming the tissue for ICI response14.
Within the interface region, fibroblast cells expressing PPP pathway marker G6PDHIGH were enriched in non-responding patients, while levels of plasma cells expressing granzyme B and hexokinase1, and B cells expressing PD-1 and SDHA also associated with poorer outcomes. Interestingly, stromal expression of tryptophan pathway enzyme, IDO1, in granulocytes, immune NOS cells, and macrophages as well as HLA-A in tumor cells associated with better outcomes, suggesting a benefit for lower inflammatory stromal microenvironment (Fig. 3d). Assessment of marker positivity levels for PFS indicated tumor localized granzyme B+ macrophages to be enriched in patients with early relapse, passing FDR adjustment (Fig. 3e) in accordance with our previous analysis.
Immune cell ratios are widely discussed in the context of anti-tumor responses15,16. We explored this within both definitions of tumor regions (K = 2, K = 3 CNs) and observed that higher ratios of granulocytes to CD8+ T cells within tumor regions associated with relapse, as well as high stromal B cells to tumor region myofibroblast and immune cell populations. When incorporating the tumor interface region, we observed that elevated levels of granulocytes in the interface region relative to stromal B cells associated with poorer outcome (Supplementary Fig. 2).
Metabolic neighborhoods
To investigate the role of metabolic activity in each TMA core, a metabolic density clustering approach derived from CNs11 (Fig. 4a) was applied to identify metabolic neighborhoods (MBNs; see methods). Four distinct clusters were described: minimal, low, medium and regulatory activity, and high metabolic activity. These neighborhood descriptions specified tissue regions which followed discrete levels of metabolic pathway activity with high MBN displaying high SDHA expression and low MBN displayed reduced CPT1a expression, concurrent with high and low energy demands. Overall characterization of cell types for their predominant pathways indicated that granulocytes highly expressed several OXPHOS pathways, while tumor cells had high ATP synthesis (Fig. 4b, c).
Fig. 4: A metabolic profile of the NSCLC TME.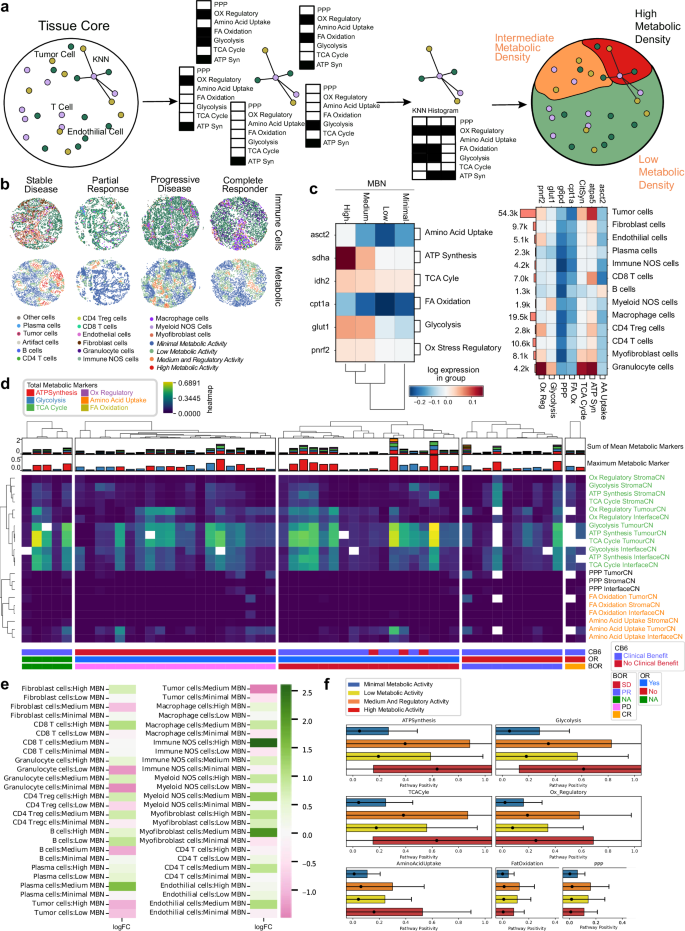
a K-means clustering on KNN histograms of metabolic pathway positivity was used to cluster regions of similar metabolic density. b A profile of the cellular and metabolic characteristics of four tissue cores, all associated with patients with different best RECIST scores. c Mean pathway positivity per metabolic neighborhood. d Mean metabolic pathway positivity, stratified by tissue region CNs. Patients are split by RECIST Best Overall Response (BOR) scores. e Log-fold change for mean metabolic pathway positivity, comparing CB6 positive to CB6 negative responses in patients. f Box and whisker plots of pathway positivity of all cells in each MBN. Data are presented as mean value, standard deviation as box, and 2 SDs as whiskers. Source data are provided as a source data file.
Examination of the frequency of each discrete metabolic pathway within our previously defined tumor/stroma/interface tissue regions indicated that OXPHOS pathways clustered together and were enriched within the tumor and interface regions, consistent with a predominant metabolic contribution by tumor cells. Interestingly, RECIST BOR responder groups (PR, CR) demonstrated lower levels of cellular energy production pathways in tumor and interface regions when compared to other BOR groups, consistent with the role for the Warburg effect and higher glycolytic activity in more aggressive cancers (Fig. 4d).
We probed changes in cell frequency within each MBN for associations with clinical benefit. We noted an increase in tumor cells within higher activity MBNs was associated with poorer outcomes, as well as the presence of granulocytes in lower activity MBNs. Interestingly, enrichment of immune NOS cells in high MBN regions appeared to be associated with clinical benefit (Fig. 4e), indicating beneficial lymphocyte infiltration to those regions. High metabolic activity was dictated by ATP synthesis, glycolysis, TCA Cyle, regulatory, and amino acid uptake pathways. Medium and regulatory activity was associated with increased FA oxidation and the PPP (Fig. 4f).
Higher level feature engineering to better model tissue architecture
Our analysis thus far focused on cellular frequency within tissue regions defined by tumor or metabolic descriptive regions. We sought to extend the depth of analysis by designing a comprehensive feature generation pipeline that combined regional properties with cell-cell interaction and proximity features. Features were engineered to describe density, proximity, and relative clustering of base cell types, functional types, and metabolic types at a variety of distance scales within the core. Cell proportions and proportion ratios were specified for all cell types, including immune and tumor functional types, within K = 2 and K = 3 CNs, in addition to the four MBNs. Large-scale interaction and proximity were characterized by the JSD Score feature, which provides a symmetric and normalized measure of the overlap of the cell type probability distributions. A Python implementation of the distance as previously described17 was computed for the cell/cell plus functional/metabolic density within each neighborhood. More localized measures of the proximity of cells were captured by the G-Cross feature, which represents the area under the curve (AUC) of the nearest neighbor cumulative radial distribution of cell/cell or functional/metabolic types, computed up to a radius of 150 µm. Since this feature captures nearest-neighbor distances, this radius was chosen to be above the scale of expected local interactions, but less than the core radius to reduce biases by missing cells outside of the core boundary. Localized boundary packing of cell types has been found to correlate with patient response to therapies in spatial biology18,19, therefore we built an edge-cell definition by constructing the concave hull of each CN and computed the G-Cross for these edge cells across CNs. More localized interactions were captured by the SCIMAP spatial interaction metric20, computed within each CN for each phenotype over a radius of 100 µm (Fig. 5a).
Fig. 5: An overview of the feature engineering in this analysis.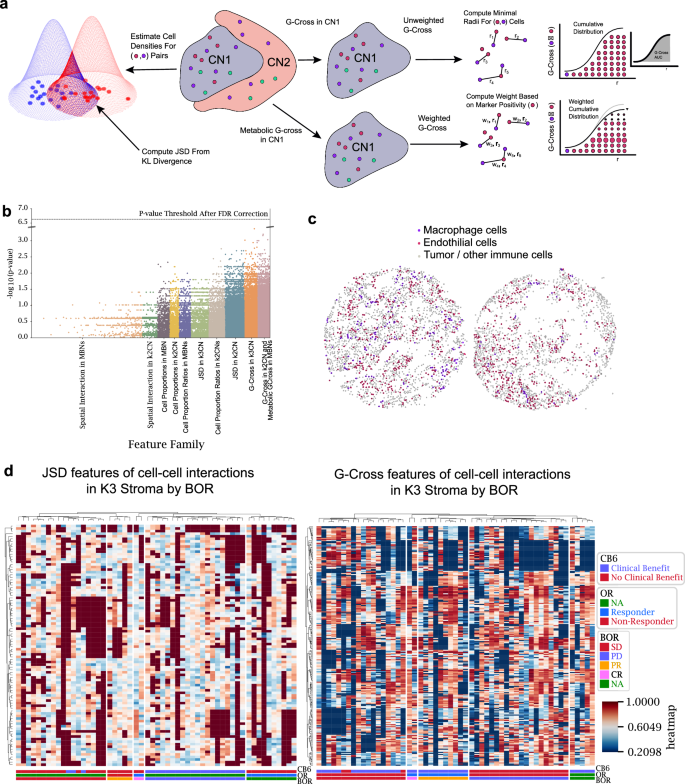
a Representative graphic of three feature types: G-Cross, metabolically weighted G-Cross, and JSD features. b Predictive features after false discovery rate (FDR) correction. c Representative cores showing extremes in JSD scores between macrophages and endothelial cells. The left core shows macrophages interspersed amongst the stroma, whereas the right core shows localized clustering of macrophages away from the stroma, indicating little overlap of the cell densities. d Feature trends across patient response groups stratified by best overall response (BOR). Abbreviations as follows: no evidence of disease (NA) complete response (CR), partial response (PR), stable disease (SD) and progressive disease (PD), overall response (OR), response status at 6 months (CB6). Source data are provided as a source data file.
Testing of all engineered features against patient response using a traditional Mann–Whitney U test revealed that the univariate P values differed between feature types and feature families (Fig. 5b). After Benjamini–Hochberg P value correction, no features approached the false-discovery rate threshold, motivating more advanced statistical methods for the analysis to search for biomarkers and to accurately model patient outcomes. Particularly, interaction-related features such as JSD and G-Cross had higher variability in P values than cellular/cellular plus functional/metabolic ratios in compartments alone. As an example, an extreme value of JSD between macrophages and endothelial cells within the cohort are shown, where interspersion of the two cell types resulted in maximum overlap probability (left), whereas the self-clustering of macrophages away from endothelial cells resulted in minimal overlap in the core (right) (Fig. 5c). A profile of JSD and G-Cross features for cell-cell interactions in our analysis presented no obvious feature trends across patient response, highlighting the need for more functional or metabolic stratification in our feature space than base cell-type interactions (Fig. 5d).
Clinical benefit spatial feature selection
A unique challenge when analyzing spatial metrics are the numerous feature spaces generated. Here, over 1049 K engineered features were generated. To address this, the features were run through the Stabl package21, a biomarker and feature selection software designed to select statistically robust features that distinguish clinical outcomes from high-dimensional datasets. The package allows for stable selection of relevant features while also estimating a bound on the false-discovery rate (FDR) of uninformative features by artificial feature injection (Supplementary Fig. 3). Prior to feature selection, features were normalized with standard-scale normalization, missing values were imputed as zeros (with the exception of the JSD metric, where null values were imputed as 1), and finally grouped into feature family sets (cell proportions in K = 2 CNs, JSD in K = 2 CNs, JSD in K = 3 CNs, G-Cross in MBNs etc.). Stabl was used to select features within each feature family (Fig. 6a).
Fig. 6: Selection and validation of features associated with clinical response to NSCLC.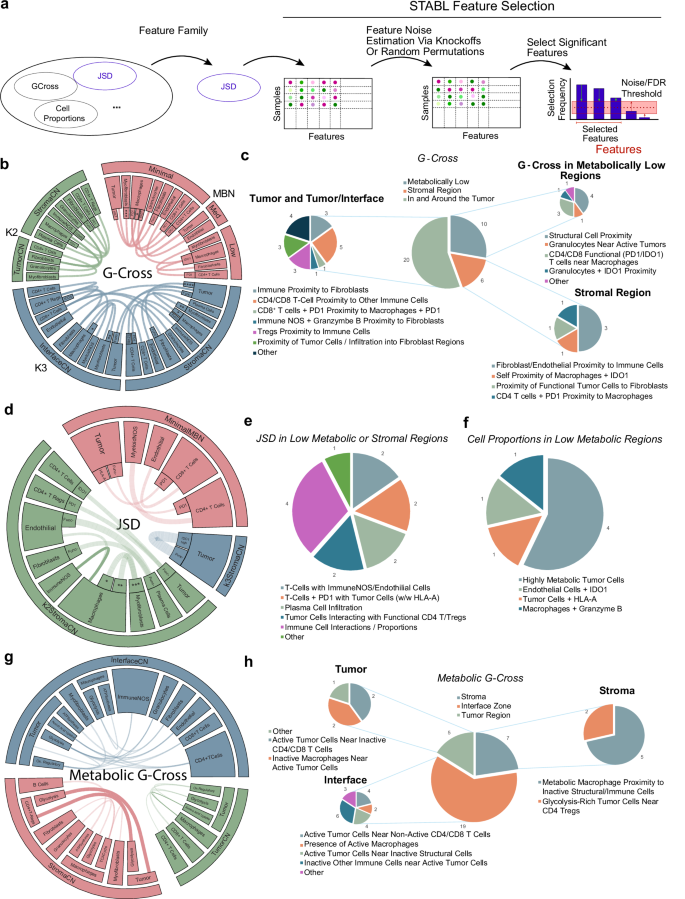
a An overview of the Stabl feature selection employed in this analysis, where feature families are tested for stable feature selection across a range of pseudo-experiments that account for false discovery rates via noise injection to derive informative/uninformative features. b, d, g An overview of the G-Cross features selected by Stabl. Chords represent connections between cell types or cell plus functional/metabolic states in different cellular or metabolic neighborhoods. Chords with heavy lines represent features that are statistically significant in univariate log-rank tests for statistical differences in progression-free survival. For b: *=ATPA5high+citrate synthasehigh+GLUT1high+IDH2high+sdha, **=ATPA5high+IDH2high, ***=ATPA5h+ IDH2high,****=Ki67_HLA-Ahigh. For d:(*=ATPA5high citrate synthasehigh GLUT1high IDH2highSDHA,**=GLUT1highIDH2high,***=ATPA5highIDH2high). Blank inner slices indicate functionally/metabolically negative cell types. c, e, f, h Charts showing a qualitative description of the selected G-Cross features for each compartment. Source data are provided as a source data file.
From our high-dimensional feature space, 87 features were selected, of which 7 features were cell proportions within low activity MBNs, while the remaining consisted of JSD and G-Cross interaction values in tissue or metabolic regions. Regularization paths and false-discovery estimates from the feature selection method are shown in Supplementary Fig. 4, and feature distributions are shown in Supplementary Fig. 5. We focused on several of these cell-cell interaction feature sets to evaluate the interpretability of the model. From the G-Cross selected features that associated with worse clinical benefit within the tumor and interface regions, the proximity of tumor cells to fibroblasts, proximity of PD-1+CD8+ T cells to PD-1+macrophages, as well as the proximity CD4+/CD8+ T cells to other immune cells were selected.
Conversely, features associated with clinical benefit were immune cell proximity to fibroblasts, indicative of immune accessibility, granzyme B+ immune NOS cells in proximity to fibroblasts, and CD4+ Tregs in proximity to immune cells, facilitating priming, in the tumor and interface regions. Granulocytes near active tumor cells in metabolically low regions, and self-proximity of IDO1+ macrophages as well as functional tumor cell proximity to fibroblast cells, potentially showing tumor containment within stromal regions, were also positively associated. The maximum false-discovery rates of uninformative features were ~35%, 30%, 25%, and 20% for G-Cross features in K = 2 CNs, K = 3 CNs, across CN edge cells, and in MBNs, respectively (Fig. 6b, c).
Selected JSD interaction features associated with relapse within low metabolic or stromal regions were composed of PD-1+ T cells near tumor cells both expressing and not expressing HLA-A, T cells in proximity to immune NOS or endothelial cells, and tumor cells interacting with functional CD4+ T cells or Tregs. Within these regions, selected features associated with clinical benefit indicated higher densities of plasma cell infiltration. The estimated maximum false-discovery rate of uninformative JSD features was ~15%. Seven proportional features within low metabolic regions were selected, with an estimated false-discovery rate of 50%, where highly metabolic tumor cells, tumor cells expressing HLA-A, and granzyme B+ macrophages had a negative clinical effect. Here, IDO+ endothelial cells were associated with a positive clinical benefit (Fig. 6d–f).
Stabl selected 31 metabolic G-Gross features across the tumor, interface, and stroma, with a maximum estimated 50% false-discovery rate of uninformative features. Inactive macrophages near tumor cells within the tumor compartment were associated with negative clinical benefit. Inactive CD4+/CD8+ T cells near active tumor cells within the tumor and interface regions also had a negative association. Metabolically active macrophages near inactive structural or immune cells were also negatively associated (logHR > 0). Glycolytic tumor cells near CD4+ Tregs were also associated with better clinical benefit (logHR < 0) (Fig. 6g, h). These interaction features point to a dynamic signaling environment that underpins processes involved in both resistance and response to ICI.
Survival predictions based on selected features
Feature selection using binary endpoints enabled a robust statistical framework to be applied, however further modeling was required to assess the power of these spatial features to predict PFS events. CoxPH regression was performed on all selected features, providing log-Hazard Ratios for PFS (top) and OS (bottom). Only significant features are shown (Fig. 7a) where features whose range intervals did not cross the logHR = 0 threshold were significant in the context of hazards. Top features indicative of progression included G-Cross interactions between tumor cells and macrophages, and granzyme B+ macrophage frequency in low metabolic activity MBNs. AUCs from k-fold CoxPH fits on PFS and OS indicated that the predictive AUC for OS is around ~0.7, and that the predictive AUC for PFS is around ~0.8 for a remarkable period of 24 months. A full list of selected features can be found in Supplementary Fig. 3a. A supplementary model based directly on time to event (PFS) feature selection identified many similar features (37/88), exhibiting common themes of metabolic pathways and interactions (Supplementary Fig. 3b–d) with similar predictive power (AUC ~ 0.9). The binary model is shown here for consistency with previous binary tests.
Fig. 7: Clinical/hazard modeling and predictive scoring using selected features.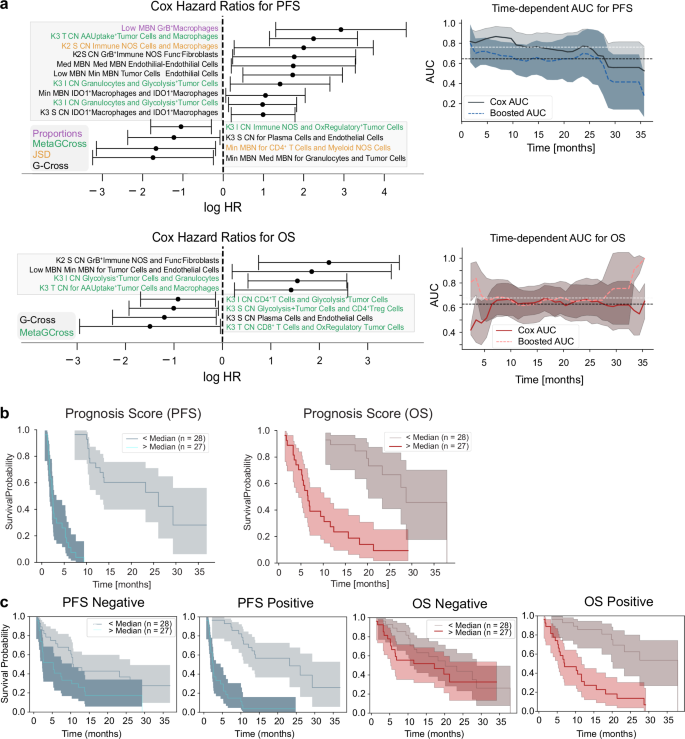
a Cox Proportional Hazard model Hazard Ratios (HRs) for the significantly selected features. Data are presented as mean HR values with 95% confidence intervals. Time-dependent AUCs from k-fold validation fits show predicted progression-free survival (top) and overall survival (bottom) with AUCs between 0.7 and 0.8 (top). Boosted AUCs are computed by additional gradient boosted survival model fits to the data. Data are presented as mean AUCs values with 95% confidence intervals. Abbreviations are as follows; MBN metabolic neighborhood, T tumor, S Stroma, CN Cellular neighborhood, I Interface. b Prognosticative scores formed by the multiplication of Cox Proportional Hazards model hazard ratios with normalized feature values, split by median values, are statistically significant predictors of overall survival and progression-free survival. Data are presented as mean KM values with 95% confidence intervals. c Prognostic scores formed from multiplication of positive HR features do not predict OS (first column) but do predict PFS (second column). Scores formed from negative HR features predict both OS (third column) and PFS (fourth column). Data are presented as mean KM values with 95% confidence intervals. All plots shown are representative of the test cohort, n = 55. Source data are provided as a source data file.
Furthermore, we sought to define the cross-cohort predictive power by fitting each cohort to prediction models using both the CB6 and time to event PFS selection method (CB6 model; cohort YTMA471 AUC 0.73, cohort YTMA404 AUC 0.65, PFS model; cohort YTMA471 AUC 0.87, cohort YTMA404 AUC 0.93) (Supplementary Fig. 3e). We additionally implemented a grouped bootstrap sampling method where only one cohort was utilized during each subsampling fit performed during the feature selection. This method pulled more significant features by equally weighting the YTMA404 cohort, which contained fewer patients but had lower average PFS times.
Notably, seven of these features were common to all three feature selection models (combined, YTMA404/YTMA471 independent) and were each significant by Kaplan–Meier tests, supporting generalizability of features across two independent cohorts (Supplementary Fig. 3e). Features that were predictive of benefit to ICI included the interaction between ICOS + CD4 Tregs and fibroblasts in the tumor interface region, suggesting Treg exclusion, as well as CD4 Tregs interacting with glycolysis+ tumor cells in stromal regions, implicating a role for TME immune suppression of isolated tumor cells. Negatively associated features implicated macrophages in several scenarios, where self-aggregation of IDO1+ macrophages in low metabolic regions, and granzyme B+ macrophages in low metabolic regions were associated with poorer ICI outcomes (Supplementary Fig. 3e).
To summarize our feature selection models, features from the CB6 selection were combined to form a single prognosis score, where the HR of each feature was multiplied by the normalized feature value for each patient. Prognosis scores, split by median values, correlated with OS and PFS (Fig. 7b) although validation on a larger cohort is needed for cross-validation to confirm that this method gives an appropriate indication if a patient will progress or not (PFS p < 1e−7, OS p = 1e−7).
We further expanded this approach to derive a discrete signature that might describe either resistance (mean logHR > 0, 43 features), or response (mean logHR < 0, 44 features). These individual signatures indicated successful prediction of response for PFS (p = 0.016), as well as for prediction of resistance for both OS (p = 7e−6) and PFS (p < 1e−7). Our study thus culminated in the successful development of both expanded and discrete feature sets that describe patient response to ICI therapy in our discovery cohorts of fifty-five total patients (Fig. 7c).


