

Single-cell transcriptional profiling identified four principal cell types in mouse condyles
The anterior premature contact (APC) and unilateral anterior crossbite (UAC) models induced remarkable TMJOA-like lesions in the condyles (Fig. 1a–c). The histology demonstrated the rough surface, erosion of the cartilage by ossification regions, reduced thickness of the cartilage layer and disordered arrangements of cells in the cartilage (Fig. 1c). After unsupervised clustering of the 3 datasets combined (ctrl, APC, UAC), the captured cells were segregated into 14 distinct cell clusters (Fig. 1d), which were classified into chondrocytes, immune cells and endothelial cells/pericytes (Fig. 1e, Supplementary Fig. 1). Cells in clusters 0 ~ 4 and 6 ~ 10 highly expressed chondrocyte markers Sox9, Acan, and were identified as ‘chondrocytes’. Clusters 5 and 11 ~ 13 were annotated as ‘immune cells’ based on enrichment of Csf3r, Lyz2, Slpi, Retnlg and Cybb. Cluster 14 was identified as ‘endothelial cells/pericytes’ by expressing Pecam1, Cdh5, Rgs5 and Mcam. Cluster 14 was further classified into endothelial cells and pericytes (Supplementary Fig. 2). Compared with the control group, the condyles of the APC or UAC model had decreased proportions of chondrocytes and increased proportions of immune cells (Fig. 1f, g).
Fig. 1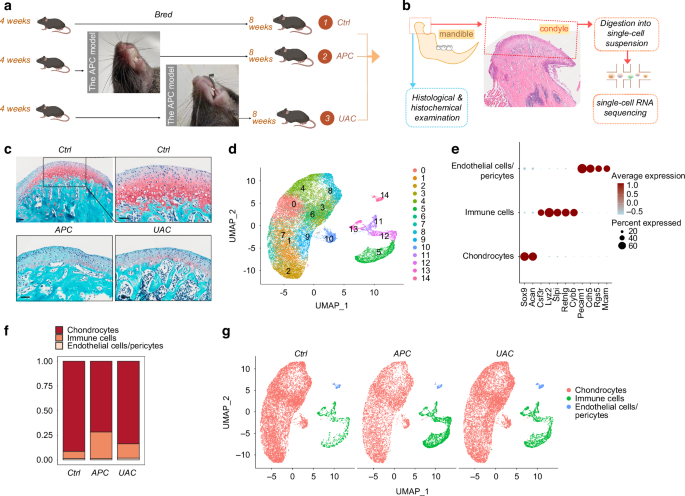
Single-cell transcriptional profiling of the cells in the mandibular condyle. a The time frame and model construction. b A Schematic of the mouse mandibular condyle tissue harvested for single-cell transcriptomic analyses. c Saffron-O and fast green staining of the condyles of the healthy mice (ctrl) and mice subjected to the APC or UAC model. Scale bar: 50 μm. d Cell clusters from scRNA-seq analysis visualized by UMAP. e Feature plot showing the expression of chondrocytes markers, immune cells markers and endothelial cells/ pericytes markers. f Bar plot showing the proportion of cell types in ctrl, APC, and UAC group, respectively. g Visualization of cell clusters in scRNA-seq analysis of ctrl, APC, and UAC by UMAP
Chondrocyte heterogeneity in healthy and TMJOA condyles
Chondrocytes were the main cellular components in the mandibular condyle, constituting 91.36% of the total identified cells and 98.65% of the non-immune cells during homeostasis (Fig. 1f). The chondrocytes were heterogeneous in terms of transcriptional expressions and biological functions. Single-cell RNA sequencing (ScRNA-seq) of the 3 datasets combined (ctrl, APC, UAC) identified 16 cell clusters with distinct gene expression profiles (Fig. 2 & Supplementary Figs. 3, 4) and functions (Supplementary Fig. 5). Cells in cluster 7 and 9 were classified as ‘mature chondrocytes’ based on enrichment of chondrocyte markers Col9a1, Col11a2, Scrg1. Custer 0 and 2, also showing enrichment of these chondrocyte markers, was labeled ‘Col10a1high hypertrophic chondrocytes (HTC)’ due to high expressions of HTC markers Col10a1 and enrichment for GO terms ‘biomineralization’, ‘ossification’ and ‘osteoblast differentiation’. These clusters also abundantly expressed Ibsp. Cluster 4, 5 and 11 highly expressed pro-inflammatory markers Nos2, and was thus labeled ‘inflammation-associated (IA) chondrocytes’. These clusters also abundantly expressed Cxcl1, Cxcl2, Cx3cl1 and TGF-β signaling gene Inhba. GO enrichment analysis suggested functional features of leukocyte migration and activation, cytokine- and chemokine-mediated signaling for this cluster. Cells in cluster 6, 13, 14 and 15 were annotated as ‘Mmp13high chondrocytes’ featured by high expressions of Mmp13. These clusters also abundantly expressed Ifitm3 and Lum. Cluster 1 was labeled ‘reparative chondrocytes’ based on remarkably increased Atf3, Hspa1a and Hspa1b, and enrichment for GO terms ‘response to unfolded protein’ and ‘cellular response to topologically incorrect protein’, ‘negative regulation of inflammatory response’ and ‘negative regulation of leukocyte activation’. Clusters 3, 8 and 16 highly expressed fibroblast/fibrosis markers S100a4 (also known as fibroblast-specific protein 1, FSP1) and Abi3bp, thus were incorporated and annotated as ‘fibrotic chondrocytes’. These clusters also abundantly expressed Thbs4 and Mfap4. The enriched biological functions of this cluster were closely related to extracellular matrix organization, cell-matrix adhesion, regeneration and wound healing. Cluster 10 was identified as ‘mineralization-associated chondrocytes’ due to highly specialized functional features of biomineralization suggested by GO enrichment analysis. These cells highly expressed Ifitm5 and osteocalcin encoding genes Bglap and Bglap2. Cells in cluster 12 abundantly expressed stem-cell-related markers Stmn1, Birc5 and cell cycle genes Cdk1, Top2a, Cenpa and Mki67, thus was annotated as ‘chondrocyte progenitors’, with enriched biological processes related to mitosis and cell cycle.
Fig. 2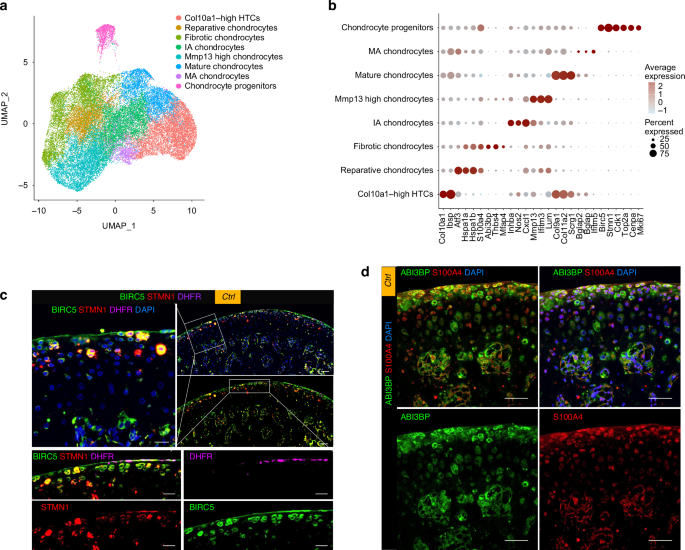
The differentially expressed gene pattern distinguished 8 chondrocyte populations in the mandibular condyles in homeostasis and TMJOA. a Chondrocytes subtypes from scRNA-seq analysis visualized by UMAP. b Dot plot showing the expression of selected markers of various chondrocyte subtypes. c Multiplexed immunofluorescence staining of the healthy condyle for detection of progenitor cell markers BIRC5 (green), STMN1 (red) and DHFR (purple). Scale bar: 50 μm for the low-power field, 20 μm for the high-power field. d Co-immunofluorescence staining of the healthy condyle for detection of the fibrotic markers ABI3BP (green) and S100A4 (red). Scale bar: 50 μm
During homeostasis, the chondrocyte progenitors (Fig. 2c) and fibrotic chondrocytes (Fig. 2d) were found to reside in the superficial zone in the Condyle. The NOS2high IA chondrocytes resided below the superficial layer (Fig. 3a). The Col10a1high, Mmp13high, and Bglaphigh chondrocytes were distinct clusters, among which the cells highly expressing COL10 resided in the deep layer adjacent to the osteochondral junction, while the MMP13high OCNhigh chondrocytes were above the deep layer (Fig. 3b).
Fig. 3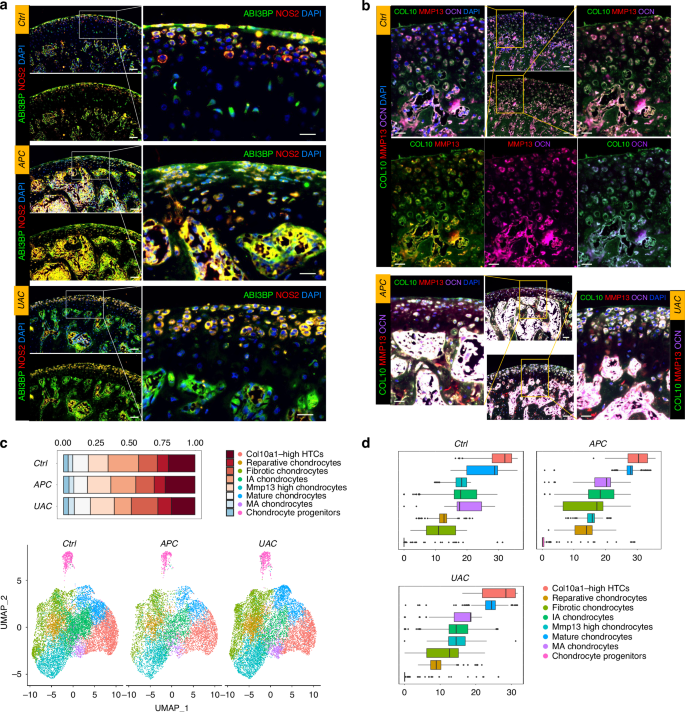
Comparison of cell composition and pseudotime developmental trajectory of the chondrocytes between healthy and TMJOA condyles. a Co-immunofluorescence staining of the condyle for the ‘fibrotic chondrocytes’ marker ABI3BP (green) and the ‘IA chondrocytes’ marker NOS2 (red). Scale bar: 50 μm for the left panels, 20 μm for the right panels. b Co-immunofluorescence staining of the condyle for Collagen-X (COL10, green), MMP13 (red) and osteocalcin (OCN, purple). Scale bar: 50 μm for the low-power field, 20 μm for the high-power field. c Bar plot showing the proportion of chondrocytes subtypes in Ctrl, APC, and UAC groups, respectively. Visualization of cell clusters in scRNA-seq analysis of ctrl, APC, and UAC chondrocytes subtypes by UMAP. d Pseudo-time analysis of chondrocytes subtypes using Monocle3 of Ctrl, APC, and UAC groups
Different TMJOA models induced different changes in frequency, composition and transcriptional phenotypes of chondrocyte and immune cell populations
ScRNA-seq revealed the transcriptomic changes in the condyles of occlusal disorder-induced TMJOA (Fig. 3). All the identified cell clusters were present in healthy and TMJOA condyles. The APC and UAC models induced reduced frequency of chondrocytes (Fig. 3c). Compared with the healthy condyle, the condyles of the APC model had increased proportions of Mmp13high chondrocytes, Col10a1high HTCs, and reduced proportions of IA chondrocytes, while the UAC-model condyle had reduced proportions of Col10a1high HTCs, IA chondrocytes, and increased proportions of Mmp13high chondrocytes, fibrotic chondrocytes and reparative chondrocytes (Fig. 3c). The proportion of chondrocyte progenitors witnessed a slight increase in the APC model and the UAC model compared to the control, which accounted for 4.07% and 3.67% in the APC model and the UAC model, respectively, and 3.48% in the control. This was in line with the immunofluorescence (Supplementary Fig. 6) that the TMJOA condyles showed regionally increased BIRC5high STMN1high cells though with regional decrease of these markers, indicating simultaneous occurrence of destruction and repair. The pseudotime analysis suggested disturbed developmental trajectory of chondrocytes in the APC and UAC models (Fig. 3d), consistent with the immunofluorescence (Fig. 3a, b) that showed disarranged and compacted chondrocytes losing cluster-dependent phenotypic characteristics during TMJOA.
The immune cells were clustered into 12 populations, which were further annotated as 9 distinct cell types (Fig. 4 & Supplementary Figs. 7, 8). The occlusal disorder models induced remarkably increased frequency of immune cells (Fig. 1f). The cell composition of the immune cell clusters indicated an expansion of neutrophils, especially Stage II neutrophil subcluster in TMJOA, in contrast of remarkable shrinkage in monocytes, macrophages and B cells (Fig. 4d). Among the top 10 DEGs in the neutrophils, we observed significantly upregulated Abcg1 and downregulated Ftl1 genes in the condyle of the APC model, indicating dysregulated lipid homeostasis and cellular iron metabolism; while in the UAC model, increased expressions of Hspala/b,Il1r2 and Thbs1 in neutrophils were noted, indicating enhanced repair and tissue remodeling (Supplementary Fig. 9).
Fig. 4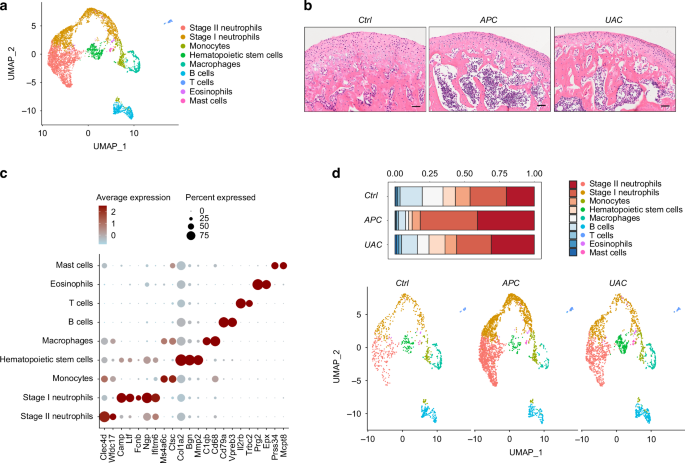
Single-cell transcriptomic atlas of the immune microenvironment of the TMJ condyle during homeostasis and TMJOA. a Immune cells subtypes from scRNA-seq analysis visualized by UMAP. b H & E staining showing the histology of the condyles. Scale bar: 50 μm. c Dot plot showing the expression of selected markers of various immune cells subtypes. d Bar plot showing the proportion of immune cells subtypes in ctrl, APC, and UAC, respectively. Visualization of cell clusters in scRNA-seq analysis of ctrl, APC, and UAC immune cells subtypes by UMAP
Transcriptionally inferred immune-chondrocyte interactions were enhanced and differentially regulated between the APC and UAC models
Transcriptionally inferred interactions were found between chondrocytes and immune cell subsets,and was enhanced in condyles of the occlusal disorder models (Fig. 5a), with distinct crosstalk signals (Fig. 5b, c). Compared with the healthy control, TNF signaling pathway was inferred to be the most greatly enhanced information flow in the condyle of the APC model (Fig. 5b), while BSP was indicated as the most increased signaling in the UAC model (Fig. 5c). Immunohistochemical staining confirmed high expression of TNF-α in chondrocytes and immune cells in the condyle of the APC model but not as high in the UAC model (Supplementary Fig. 10a). The immune cells at the osteochondral junction also expressed increased levels of IL-6 and IL-10 (Supplementary Fig. 10a).
Fig. 5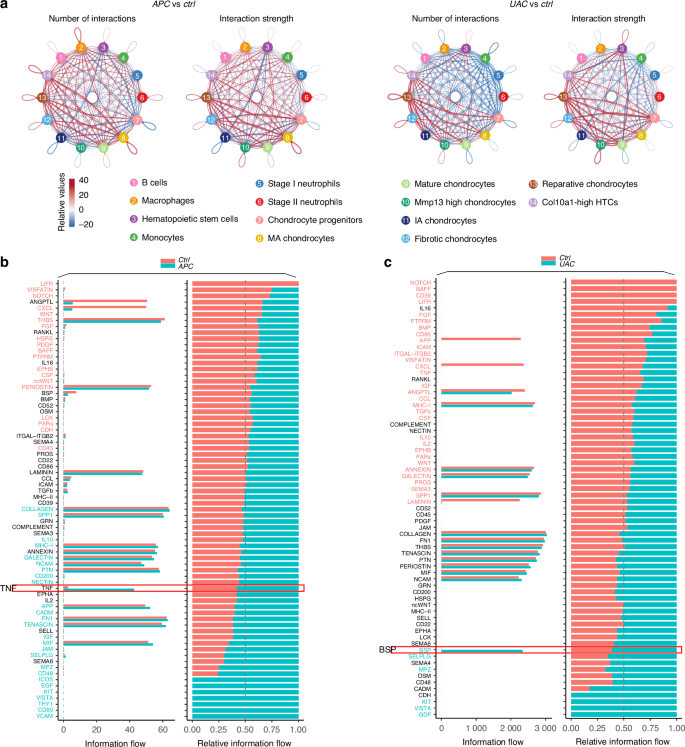
Transcriptionally inferred cell-cell interactions and signaling flows in the APC- or UAC-exposed condyles compared with the healthy control. a Circle plots showing differential number of interactions and interaction strength compared the APC with the ctrl group, or compared the UAC group with the ctrl group. Red colored edges indicate increased signaling in the APC or UAC group and blue colored edges indicate decreased signaling in the ctrl group. b Bar plots showing the overall information flow of each signaling pathway in the ctrl group and the APC group. c Bar plots showing the overall information flow of each signaling pathway in the ctrl group and the UAC group
Single-cell transcriptome analysis suggested that the outgoing TNF signaling, while derived mainly from macrophages during homeostasis, greatly increased and predominantly derived from Stage II neutrophils in the condyle of the APC model, with enhanced potential interactions with other immune cells and chondrocytes (Fig. 6a, b, Supplementary Fig. 10b). The immunofluorescence showed significantly increased production of TNF-α in the chondrocytes, MPO+ neutrophils and CD68+ macrophages in the APC model (Fig. 6c, d). The outgoing BSP signaling, which increased greatly in the UAC model, derived mainly from Col10a1high HTCs, mineralization-associated chondrocytes and mature chondrocytes (Supplementary Fig. 10c). The signaling analysis suggested dominant roles of Thbs1-Sdc4 and Col2a1 signaling in mediating the Stage I/II neutrophils-to-chondrocyte interactions, with much stronger output of these signals from neutrophils towards chondrocytes in the UAC model than in healthy control (Fig. 7a, b). The Col2a1 signaling was enhanced more among chondrocytes than in neutrophils-to-chondrocyte interactions (Fig. 7a). The immunofluorescence (Fig. 7c, d) showed widespread BSP-positive areas from the cartilage to subchondral bone in the condyle of the UAC model, with high immunoreactivity in the bone and osteochondral junction areas. These areas co-localized with expressions of the endothelial marker CD31.
Fig. 6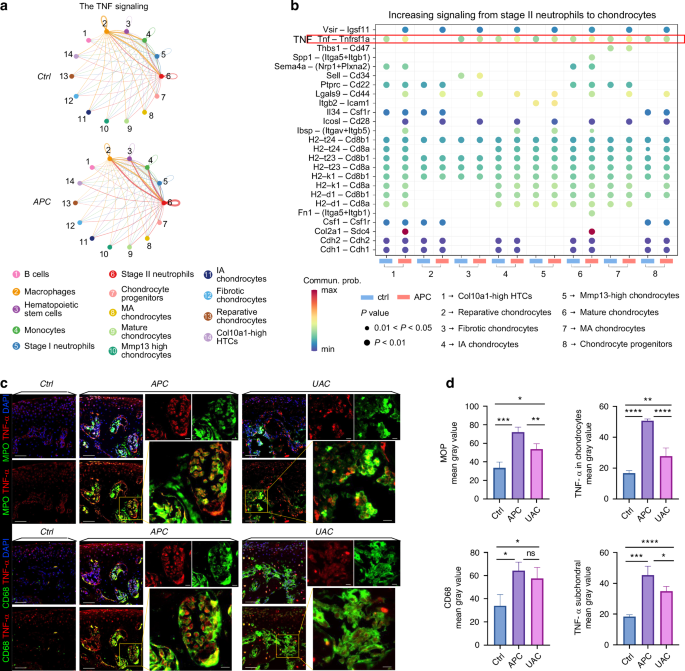
Single-cell transcriptome analysis highlight predominant role of neutrophil-derived TNF signaling in mediating immune-chondrocyte interaction in the APC-exposed condyles. a Circle plot of TNF signaling network. b Bubble plot of the communication probability of all the significant ligand-receptor pairs that contributed to increasing signaling sent from Stage II neutrophils to each cell population in chondrocytes. c Co-immunofluorescence staining of the condyle for Myeloperoxidase (MPO, green) and TNF-α (red), or for CD68 (green) and TNF-α (red). Co-localization of MPO and TNF-α indicates production of TNF-α from neutrophils. Scale bar: 50 μm for the low-power field, 10 μm for the high-power field. d Semi-quantitation of the expression levels of MPO, CD68 and TNF-α. *P < 0.05. **P < 0.01. ***P < 0.001. ****P < 0.000 1
Fig. 7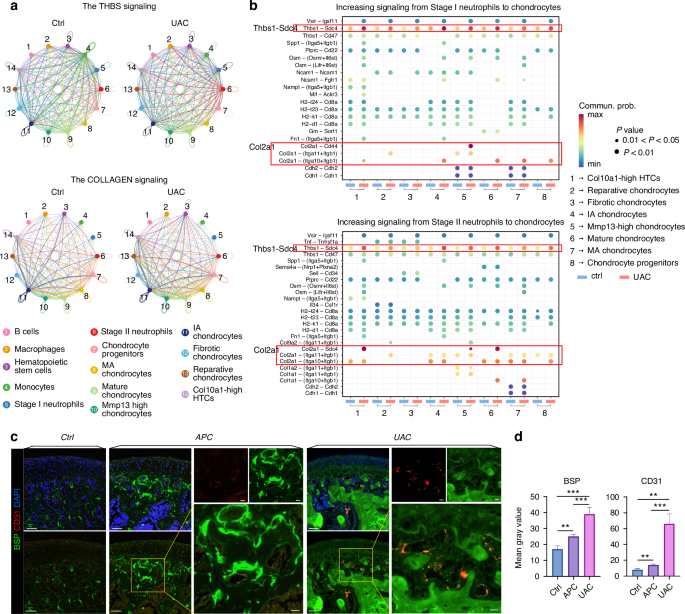
Enhanced chondrocyte-derived BSP signaling accompanied by increased angiogenic marker expression and neutrophil-derived THBS signaling in the UAC-exposed condyles. a Circle plot of THBS and COLLAGEN signaling networks in the ctrl group and the UAC group. b Bubble plot of the communication probability of all the significant ligand-receptor pairs that contributed to increasing signaling sent from Stage I neutrophils/ Stage II neutrophils to each cell population in chondrocytes. c Co-immunofluorescence staining of the condyle for BSP (green) and CD31 (red). Scale bar: 50 μm for the low-power field, 10 μm for the high-power field. d Semi-quantitation of the expression levels of BSP and CD31. **P < 0.01. ***P < 0.001
Signal-targeted drug administration alleviated cartilage erosion in TMJOA induced by different occlusal disorders
Compared with the healthy condylar cartilage with chondrocyte layers of well-arranged hierarchy and good integrity, the APC- or UAC-induced lesions presented with significantly reduced thickness of the cartilage layer and aggravated severity of OA assessed by Modified Mankin scores (P < 0.05, Fig. 8). Administration of TNF-α inhibitor Etanercept significantly ameliorated the cartilage damage induced by the APC model (P < 0.05, Fig. 8a, b), while the protective effect was not so pronounced in the mice subjected to the UAC model (Fig. 8c, d). The CXCR2/CXCR1 inhibitor Navarixin attenuated OA induced by the UAC model (P < 0.05, Fig. 8c, d), but had no statistical significance in affecting the condyle lesion caused by the APC model (På 0.05, Fig. 8a, b).
Fig. 8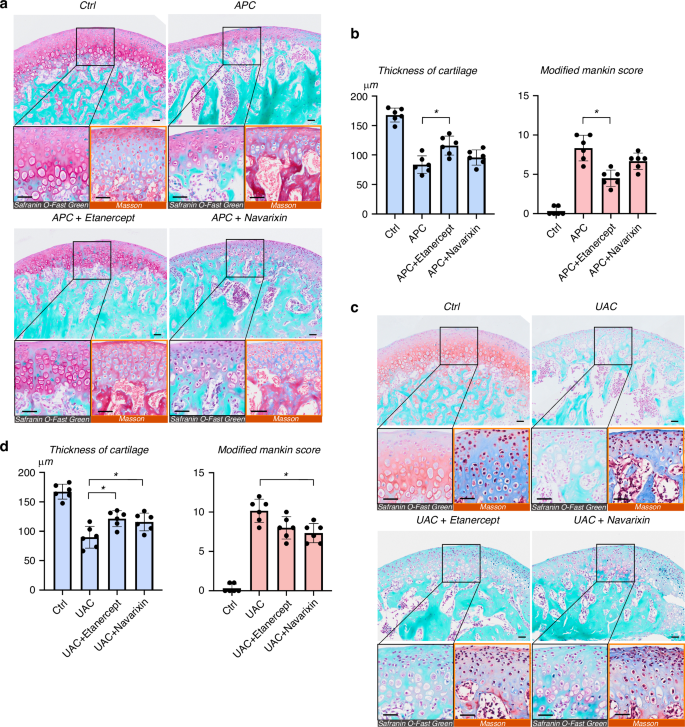
Signal-targeted therapeutic effect on TMJOA induced by different occlusal disorders. a Representative Masson staining, Saffron-O and fast green staining showing histological changes of the condyle subjected to the APC model, with or without administration of Etanercept or Navarixin. Scale bar: 50 μm. b Quantitative assessment of the histological changes evaluated by the thickness of cartilage and Modified Markins score. *P < 0.05. c Representative images showing histological changes of the condyle subjected to the UAC model, in the presence or absence of Etanercept or Navarixin treatment. Scale bar: 50 μm. d Statistical analyses of the thickness of cartilage and Modified Markins score. *P < 0.05


