

For this study, 98 RNAs were isolated from nasopharyngeal swab samples of COVID-19 positive [30 strong positive (Ct < 30), 37 low positive (Ct ≥ 30)] and 31 negative patients. Vitamin C was added to all isolated samples at five different concentrations (A: 0 mg/ml, B: 1 mg/ml, C: 10 mg/ml, D: 50 mg/ml, and E: 100 mg/ml), and PCR was carried out at four different time interval (1st, 10th, 24th and 48th hours).
Effect of vitamin C on PCR results
The impact of varying concentrations and durations of vitamin C administration on PCR test results was investigated, specifically focusing on Ct values, RFU, and graphic images of reactions for different categories of samples (Ct < 30, Ct ≥ 30, and negative). Samples with results lower than the cutoff points in the Ct and RFU measurements were evaluated as negative. Missing and unevaluable samples were excluded from statistical calculations and analyses.
The graphic view of the RT-PCR test for viral and internal control cDNA at different time intervals and vitamin C concentrations was analyzed and classified as shown in Fig. 1. In general, the graphs of an expected healthy RT-PCR are sigmoid-shaped. When the reaction yielded a negative result, the graph appeared as a jagged straight line under the baseline, as shown in Fig. 1. However, when vitamin C was administered, the graph began to change and became sinusoidal (Fig. 1c). This sinusoidal pattern was more pronounced according to the amount of vitamin C and Ct value; however, the amount of vitamin C also affected the RFU value of the reaction. In addition, when the Ct value approached a negative value, the vitamin C concentration caused the graphical image to become meaningless and unevaluable, as shown in Fig. 1d.
Fig. 1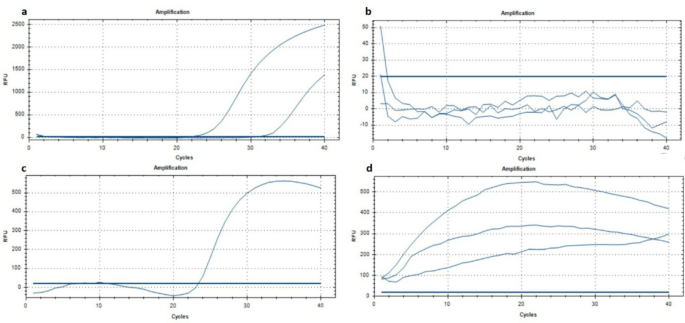
An example for graphic view classification and coding (a Sigmoidal (as expected), b negative, c sinusoidal, d unevaluable).
In Fig. 2, we evaluate the effect of different vitamin C concentrations on RFU and provide a graphic view of the RT-PCR test reactions. Samples with Ct < 30 values are grouped as “a” and “b,” samples with Ct ≥ 30 values are grouped as “c,” and samples with negative CT values are grouped as “d.” As the concentration of administered vitamin C increases, the RFU value of graphics decreases, even giving negative results for some samples with Ct ≥ 30. For samples with negative viral loads, the graphics could not be evaluated.
Fig. 2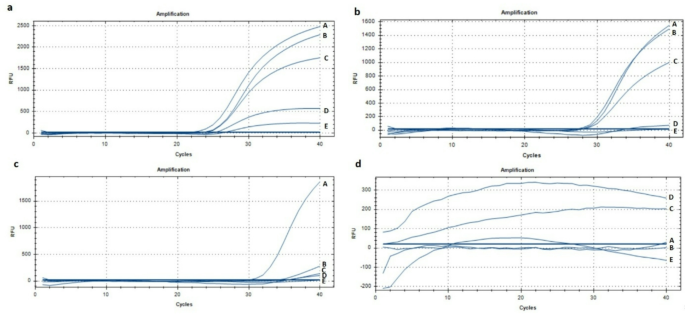
An example graphics for effect of Vitamin C on graphic of reaction for Ct < 30 (a, b), Ct ≥ 30 (c) and negative (d) samples. Concentration of Vitamin C: A: 0 mg/ml, B: 1 mg/ml, C: 10 mg/ml, D: 50 mg/ml, E: 100 mg/ml).
The distribution of positive and negative RT-PCR test results after the application of different vitamin C concentrations at different time intervals is summarized in Table 1 according to Ct, RFU (Table 1), and graphic view (Table 2).
Table 1 RT-PCR results for virus and internal control samples based on time interval and vitamin C concentration.Table 2 RT-PCR reaction images for viral RNA and internal control (RdP) mRNA samples based on different time and vitamin C concentration [1: normal (Sigmoidal, as expected), 2: negative 3: sinusoidal, 4: unevaluable].Time-dependent effects on Ct and RFU values
The Ct values of a given vitamin C concentration were statistically compared with those of other vitamin C concentrations at each time interval. The results were evaluated in three different groups (Ct < 30, Ct ≥ 30, negative groups). Table 3 shows the summarized χ2 p-values for the statistical analysis of whether different vitamin C concentrations had a significant effect on changes in Ct values. The RFU values for different vitamin C concentrations were statistically compared, and the results are summarized in Table 4. Because the internal control RdP cDNA samples could not be classified as viral load, detailed results were not obtained.
Table 3 Comparison Ct values of different vitamin C concentration in the same time interval (Those with p < 0.05 are statistically different).Table 4 Comparison of RFU values of different vitamin C concentration in the same time interval (Those with p < 0.05 are statistically different).
At least one vitamin C concentration (dose A, B, C, D, or E) was found to have a significant effect in comparison to the other concentrations during the first hour for samples with a high viral load (Ct < 30) (χ2 = 41.680; p < 0.001. Further analysis revealed a significant difference between 0 and 50 mg/ml vitamin C concentrations (Z = 5.634; p < 0.001). Similarly, statistically significant differences were observed between the doses of 1 and 50 mg/ml (Z = 5.471; p < 0.001), 50 and 100 mg/ml (Z = 3.266; p = 0.011), and 10 and 50 mg/ml (Z = 3.184; p = 0.015). Conversely, no significant differences were found between the remaining doses, indicating that their effects were comparable during the first hour of treatment (P > 0.05). In instances where differences were identified, the median Ct value at the 50 mg/ml dose exceeded those of the other doses. In the case of 100 mg/ml vitamin C, although the median Ct closely approximated the medians of other doses, the interquartile range (IQR) value was notably high. This anomaly was attributed to the disruption of the graphical images in the PCR test at 100 mg/ml vitamin C.
In the 1st hour for samples exhibiting a low viral load (Ct ≥ 30), notable variations were observed among different doses (χ2 = 44.602; p < 0.001). Upon investigating the cause of this divergence, a significant difference emerged between doses of 0, 1, and 10 mg/ml compared to doses of 50 and 100 mg/ml (p < 0.05). The median Ct values associated with low doses of vitamin C (0, 1, and 10 mg/ml) were considerably lower than those associated with high doses (50 and 100 mg/ml). In the 1st hour, the median Ct values significantly decreased following the administration of high-dose vitamin C. Remarkably, in groups subjected to low and high Vitamin C doses, the median Ct values demonstrated statistical similarity (p > 0.05).
In the 1st hour for samples with negative viral load, there was no noteworthy difference in terms of median Ct values among varying vitamin C doses (χ2 = 9.133; p = 0.058).
In the 10th hour for samples exhibiting a high viral load (Ct < 30), it was evident that at least one dose had a distinct impact compared to the others (χ2 = 40.853; p < 0.001). Upon scrutinizing the cause of this disparity, a significant difference emerged between doses of 0 and 1 mg/ml and 50 and 100 mg/ml (p < 0.05), whereas differences between other vitamin C doses were not statistically significant (p > 0.05). The median Ct values for samples administered 0 and 1 mg/ml vitamin C were lower than those for samples administered 50 and 100 mg/ml vitamin C. Meanwhile, the median Ct values for samples with 10 mg/ml vitamin C showed no significant differences compared with the other doses.
In the 10th hour for samples with a low viral load (Ct ≥ 30), it was observed that at least one dose had a distinct effect compared to the others (χ2 = 34.874; p < 0.001). Investigation of the cause of this difference revealed a significant difference between doses of 1 and 10 mg/ml and 50 and 100 mg/ml (p < 0.05), whereas differences between other vitamin C doses were not statistically significant (p > 0.05). The median Ct values for samples administered 0 and 1 mg/ml vitamin C were higher than those for samples administered 50 and 100 mg/ml vitamin C. Additionally, the median Ct values for 50 and 100 mg/ml vitamin C doses were very low, which was attributed to graphical image disruption in the PCR test.
In the 10th hour for samples exhibiting a negative viral load, it was noted that at least one dose yielded distinct effects compared to others (χ2 = 13.063; p = 0.011). Upon investigating the cause of this difference, a significant difference was observed between the 0 and 10 mg/ml doses (Z = 3.213; p = 0.013), whereas the other vitamin C doses did not exhibit statistical significance (p > 0.05). The median Ct value of samples administered 0 mg/ml vitamin C was higher than that of samples administered 10 mg/ml vitamin C. The PCR test reaction was affected by the deterioration of the graphic images, which was the reason for this discrepancy.
In the 24th hour, for samples with a high viral load (Ct < 30), it was observed that at least one dose had a distinct effect compared to the others (χ2 = 64.160; p < 0.001). Upon investigating the reason for this difference, statistically significant differences emerged between low doses (0, 1, and 10 mg/ml) and high doses (50 and 100 mg/ml) of Vitamin C (P < 0.05), with no significant difference between low and high doses (P > 0.05). The median Ct values of samples treated with low doses of Vitamin C were notably lower than those of samples treated with high doses.
In the 24th hour for samples with a low viral load (Ct ≥ 30), it was observed that at least one dose had a different effect compared to the others (χ2 = 16.907; p = 0.000). Upon investigating the reason for this difference, statistically significant differences were found between the low doses (0, 1, and 10 mg/ml) of Vitamin C and the 50 mg/ml dose (P < 0.05). Similarly, a significant difference in the median Ct values was observed between samples treated with 50 and 100 mg/ml vitamin C (Z = 2.831; p = 0.046). The median Ct value of the samples treated with 50 mg/ml vitamin C was lower than that of the samples treated with 0, 1, 10, and 100 mg/ml vitamin C.
In the 24th hour for samples with a negative viral load, there was no significant difference in median Ct values among different vitamin C doses (χ2 = 8.929; p = 0.063).
In the 48th hour for samples with a high viral load (Ct < 30), it was observed that at least one dose had a distinct effect compared to the others (χ2 = 42.367; p < 0.001). Upon investigating the reason for this difference, statistically significant differences were observed between low doses (0, 1, and 10 mg/ml) of Vitamin C and 50 mg/ml Vitamin C (p < 0.001). Similarly, the difference in the median Ct values between the 0 and 1 mg/ml Vitamin C and 100 mg/ml Vitamin C doses was significant (p < 0.05). There were no significant differences between the other Vitamin C doses (p > 0.05). The median Ct of the samples treated with low doses of Vitamin C was notably lower than that of the samples treated with high doses of Vitamin C. The median Ct of samples treated with 50 and 100 mg/ml Vitamin C was higher than that of samples treated with the other Vitamin C doses.
In the 48th hour for samples with a low viral load (Ct ≥ 30), it was observed that at least one dose had a different effect compared to the others (χ2 = 28.542; p < 0.001). Upon investigating the reason for this difference, statistically significant differences were found between all other Vitamin C doses and the 50 mg/ml Vitamin C dose (p < 0.05). However, there was no difference in the median Ct values among the samples other than the 50 mg/ml Vitamin C dose (p > 0.05). The median Ct of the samples treated with 50 mg/ml Vitamin C was significantly lower than that of the other samples.
In the 48th hour for samples with a negative viral load, it was observed that there was no significant difference in median Ct values among different Vitamin C doses at the 48th hour (χ2 = 4.736; p = 0.315).
RFU values for a given vitamin C concentration were statistically compared with those for other vitamin C concentrations at each time interval. The results were evaluated in three different groups (Ct < 30, Ct ≥ 30, Negative groups). Table 4 shows the summarized χ2 and p values for statistical analysis of whether different vitamin C concentrations had a significant effect on the changes in Ct values.
In the 1st hour for samples with a high viral load (Ct < 30), it was noted that at least one dose exhibited a distinct effect compared to the others (χ2 = 108.087; p < 0.001). A significant difference was observed among all the other doses (p < 0.05). However, there were no differences (similar effects) between 0 mg/ml and 1 mg/ml, or between 50 mg/ml and 100 mg/ml (p > 0.05).
In the 1st hour for samples with a low viral load (Ct > 30), it was observed that at least one dose had a different effect compared to the others (χ2 = 40.180; p < 0.001). Upon examining the cause of this difference, it was found that the discrepancy between the doses of 0, 1, 10, and 100 mg/ml was significant (p < 0.05). Similarly, the difference between the 0 and 1 mg/ml doses and the 50 mg/ml dose was significant (p < 0.05). No significant differences were observed in the median RFUs among the other doses (p > 0.05).
In the 1st hour for samples with a negative viral load, at least one dose had a different effect (χ2 = 15.963; p = 0.003). However, with the application of the Bonferroni correction, no distinct group could be identified, leading to the conclusion that there was no significant difference.
In the 10th hour for samples with a high viral load (Ct < 30), it was observed that at least one dose exhibited a different effect compared to the others (χ2 = 105.107; p < 0.001). Further investigation revealed that there was no significant difference (similar effects) between 0 and 1 mg/ml, or between 50 and 100 mg/ml doses (p > 0.05). However, a notable difference in the median relative fluorescence units (RFU) was observed among all other doses (p < 0.05).
In the 10th hour for samples with a low viral load (Ct ≥ 30), it was observed that at least one dose had a different effect compared to the others (χ2 = 56.601; p < 0.001). Upon investigating the reason for this difference, it was found that the difference between doses of 0, 1, and 10 mg/ml (low Vitamin C) and 50 mg/ml and 100 mg/ml (high Vitamin C) was significant (p < 0.05). However, there was no significant difference in the median RFU between low vitamin C doses and high vitamin C doses (p > 0.05).
In the 10th hour for samples with a negative viral load, it was observed that at least one dose had a different effect (χ2 = 23.414; p < 0.001). Notably, the only significant difference was identified between the 10 and 100 mg/ml doses (Z = 3.133; p = 0.017), whereas the median RFU remained similar among the other doses (p > 0.05).
In the 24th hour for samples with a high viral load (Ct < 30), it was observed that at least one dose had a different effect compared to the others (χ2 = 110.538; p < 0.001). Further investigation revealed significant differences (p < 0.05) between doses of 0, 1, and 10 mg/ml and 100 mg/ml, as well as between doses of 0 and 1 mg/ml and doses of 10 mg/ml and 50 mg/ml (p < 0.05). However, no significant difference in the median relative fluorescence units (RFU) was noted among all other doses (p > 0.05).
In the 24th hour for samples with a low viral load (Ct ≥ 30), it was observed that at least one dose had a different effect compared to the others (χ2 = 48.511; p < 0.001). A significant difference (p < 0.05) was found between doses of 0, 1, and 10 mg/ml (low vitamin C) and doses of 50 mg/ml and 100 mg/ml (high vitamin C). Nevertheless, there was no significant difference in the median RFU between low vitamin C doses and high vitamin C doses (p > 0.05).
In the 24th hour for samples with a negative viral load, it was observed that all doses had similar effects (χ2 = 4.199; p = 0.380).
In the 48th hour for samples with a high viral load (Ct < 30), it was observed that at least one dose had a different effect compared to the others (χ2 = 88.192; p < 0.001). Upon investigating the reason for this difference, distinctions (p < 0.05) were identified between doses of 0, 1, 10, and 100 mg/ml. Additionally, differences were found between doses of 0 and 1 mg/ml and between doses of 50, 0, and 10 mg/ml (p < 0.05). However, the median RFU remained similar among all other doses (p > 0.05).
In the 48th hour for samples with a low viral load (Ct ≥ 30), it was observed that at least one dose had a different effect compared to the others (χ2 = 34.338; p < 0.001). Investigation of this difference revealed a significant difference (p < 0.05) between doses of 0, 1, and 10 mg/ml (low vitamin C) and doses of 50 mg/ml and 100 mg/ml (high vitamin C). Nevertheless, there was no significant difference in the median RFU between low vitamin C doses and high vitamin C doses (p > 0.05).
In the 48th hour for samples with a negative viral load, there was an observed difference among doses (χ2 = 11.226; p = 0.024). However, owing to the Bonferroni correction, no specific group could be identified, leading to the conclusion that there was no significant difference in the median RFU among the doses.
Graphic image analysis
The impact of varying vitamin C concentrations on RT-PCR graphic images in all samples was subjected to statistical comparison, considering viral loads and time intervals. The RT-PCR graphics were categorized numerically as follows: (a) for Normal, (b) for Negative, (c) for Sinusoidal, and (d) for Unevaluable (Fig. 1). Table 5presents summarized χ2 and p values, elucidating the statistical analysis of whether different vitamin C concentrations exerted a significant effect on graphic image alterations. Those exhibiting statistically significant differences were denoted with distinct letters. As evident in Table 5, a statistically significant difference is discernible in graphic images across viral loads in all time intervals and doses (p < 0.001). For instance, at a 0 mg/ml dose, during the 1st hour, the anticipated graphic image displayed a significant difference from higher vitamin C concentrations (χ2 = 86.500; p < 0.001).
Table 5 Analysis of the effect of different vitamin C doses on RT-PCR reaction graphic at different time intervals according to viral loads.
Examining Table 5 reveals a notable trend: as the concentration of applied vitamin C increases, there is a discernible shift in the RT-PCR graph codes, particularly towards code 3. When comparing this trend between high viral load (Ct < 30) and low viral load (Ct ≥ 30), it becomes apparent that the applied vitamin C concentration has a more pronounced impact on Ct ≥ 30 samples. In the Ct < 30 samples, the normal graphical pattern appeared to transition to a more sinusoidal pattern without significantly affecting the positive result. Conversely, for Ct ≥ 30 samples, a substantial number of positive samples exhibiting a normal image appear to shift towards a negative result (b) or an unevaluable image (d). By assessing the alteration in the graphical representation for negative samples lacking viable charge in response to the applied vitamin C concentration, it becomes evident that the graphs transform from (b) to (d). Notably, when comparing the RT-PCR graphical images based on the time interval, there seemed to be no significant correlation with the timing of the application of different vitamin C doses.


