


RecMacs display protumor transcriptional signatures
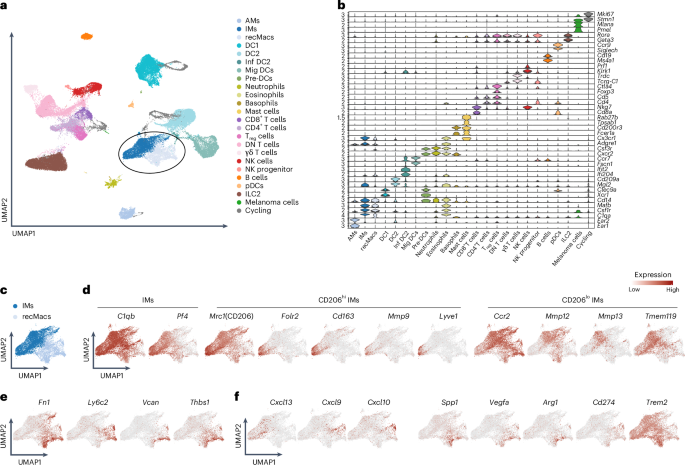
To identify macrophage subsets associated with tumor regression or progression, we flow-sorted extravascular CD64+CD11b+ mononuclear phagocytes, which include IMs and recMacs, from the lungs of wild-type (WT) C57BL/6 mice 16 days after intravenous injection of 4×10⁵ B16F10 melanoma cells and analyzed them by scRNA-seq in two separate datasets (Fig. 1a and Extended Data Fig. 1a). Unbiased Uniform Manifold Approximation and Projection (UMAP) clustering of the scRNA-seq data resolved 23 immune cell populations defined by curated markers and differentially expressed genes (DEGs) (Fig. 1b and Extended Data Fig. 1b), including Ear1 and Cidec for AMs, Mafb, Folr2 and Nes for IMs, Cd14, Ly6c2 and Fn1 for recMacs, Xcr1 for DC1 and Ccr7 for migratory DCs11. Depletion of circulating monocytes enables clear separation of resident IMs as Pf4+C5ar1+Mafb+ cells and recMacs as Ly6c2+Fn1+Vcan+1, so we resolved AMs, IMs, recMacs and DCs based on these criteria (Fig. 1b and Extended Data Fig. 1b). Despite intravascular CD45 labeling, a small residual population of intravascular CD11b+ mononuclear phagocytes, consisting of Sell+ classical and Ace+ nonclassical monocytes was still detected in one of the scRNA-seq datasets (Extended Data Fig. 1b). C1q-expressing IMs were further characterized based on Mrc1 (CD206) expression (Fig. 1c,d). CD206hi IMs expressed Folr2, Cd163, Mmp9 and higher levels of Pf4 compared to CD206lo IMs, with a fraction of CD206hi IMs expressing Lyve1 (Fig. 1d), whereas CD206lo IMs expressed Ccr2, Mmp12, Mmp13 and Tmem119 (Fig. 1c,d and Extended Data Fig. 1c–i) Within the scRNA-seq cluster of Cd14+Csfr1+ recMacs, genes were enriched for Ly6c2, Vcan and Thbs1 with high levels of Ccr2 and Fn1 (Fig. 1c,e and Extended Data Fig. 1c–i).
Fig. 1: scRNA-seq of pulmonary melanoma identifies gene signatures in CD206hi IMs, CD206lo IMs and recMacs.
a, Unbiased UMAP clustering of scRNA-seq data from flow-sorted extravascular CD64⁺CD11b⁺ mononuclear phagocytes isolated from the lungs of C57BL/6 WT mice on day 16 after intravenous injection of 4 × 10⁵ B16F10 melanoma cells. Clusters include AMs, IMs, recruited macrophages (recMacs), dendritic cells 1 (DC1), dendritic cells 2 (DC2), inflammatory DCs (Inf DC2), migratory DCs (Mig DCs), pre-DCs, plasmacytoid DCs (pDCs), neutrophils, eosinophils, basophils, mast cells, CD8⁺ T cells, CD4⁺ T cells, regulatory T (Treg) cells, double-negative T (DN T) cells, γδ T cells, natural killer (NK) cells, NK progenitors, B cells, innate lymphoid cells (ILC2), melanoma cells and cycling cells. b, Key signature genes defining the unbiased clusters as in a. c, UMAP of Pf4+C5ar1+Mafb+ IMs and Ly6c2+Fn1+Vcan+ recMacs as in a. d, Feature plots showing the expression of C1qb and Pf4 in IMs (left), expression of Folr2, Cd163, Mmp9 and Lyve1 in CD206hi IMs (middle) and expression of Ccr2, Mmp12, Mmp13 and Tmem119 in CD206lo IMs (right). e, Feature plots showing expression for Fn1, Ly6c2, Vcan and Thbs1 in recMacs. f, Feature plots showing the expression of Cxcl13, Cxcl9 and Cxcl10 in CD206hi IMs (left) and Spp1, Vegfa, Arg1 and Cd274 in recMacs and Trem2 in recMacs and IMs (right).
We next assessed the expression of genes linked to anti- or protumorigenic programs. CD206hi IMs predominantly expressed antitumorigenic chemokines, including Cxcl13, Cxcl9 and Cxcl10, whereas CD206lo IMs and Fn1+Vcan+ recMacs expressed the protumorigenic genes Ccl2; all populations expressed Trem2 (Fig. 1f and Extended Data Fig. 1j)31. Fn1+Vcan+ recMacs were further enriched for canonical tumor-promoting transcripts, such as Spp1, Vegfa, Arg1 and Cd274 (which encodes PD-L1) (Fig. 1f and Extended Data Fig. 1h). Thus, IMs and recMacs displayed distinct gene expression profiles, with CD206hi IMs expressing chemokine transcripts associated with lymphocyte positioning (Cxcl13, Cxcl9 and Cxcl10), whereas Ccl2 expression was observed on both IMs and recMacs, with recMacs enriched for transcripts previously linked to tumor-promoting macrophage programs in lung cancer models32.
CD206hi IMs restrain tumor growth by enabling TLS formation
IMs differentiate into at least ten distinct chemokine-expressing (IMck) subsets, including IMck0 (nonspecific chemokine expression), IMck1 (Ccl2, Ccl7, Ccl12 and some Cxcl14), IMck2–IMck4 (Ccl3, Ccl4, Ccl5, Cxcl1, Cxcl2 and Cxcl3), IMck5 (Ccl8), IMck6 (Ccl6 and Ccl9), IMck7 (Cxcl9 and Cxcl10), IMck8 (Cxcl13) and IMck9 (Ccl24) which have protective roles in pulmonary inflammation and infection1. To determine the function of IMck7 (Cxcl9 and Cxcl10) and IMck8 (Cxcl13) in cancer, we used Pf4CreCx3cr1DTR mice, in which Pf4Cre activity is restricted to mature immune cells that transcriptionally express Pf4, including megakaryocytes, peritoneal macrophages and IMs, but only IMs coexpress Cx3cr1 and therefore selectively express the diphtheria toxin (DT) receptor (DTR)1. Following a single intravenous injection of DT, only high expressing Pf4⁺Cx3cr1⁺ IMs were targeted, resulting in preferential depletion of CD206hi IMs, including Cxcl13+ CD206hi IMs, Cxcl9+ and Cxcl10+ CD206hi IMs, as well as subsets of CD206hi IMs expressing Ccl6, Ccl8, Ccl9 and Ccl24 (ref. 1). CD206hi IMs, which also highly express FOLR2, were maximally depleted by day 7 post-DT injection and recovered by day 15 (Fig. 2a). Hematoxylin and eosin (H&E) staining, PECAM-1 (CD31) and SMA staining showed comparable microvessel density and tissue area in control Cx3cr1LSL-DTR mice (hereafter Cx3cr1DTR) and Pf4CreCx3cr1DTR mice at day 10 post-DT (Supplementary Fig. 1), indicating that lung morphology and vascular integrity were not affected by depletion of CD206hi IMs.
Fig. 2: CD206hi IMs organize lymphocyte recruitment and antitumor immunity.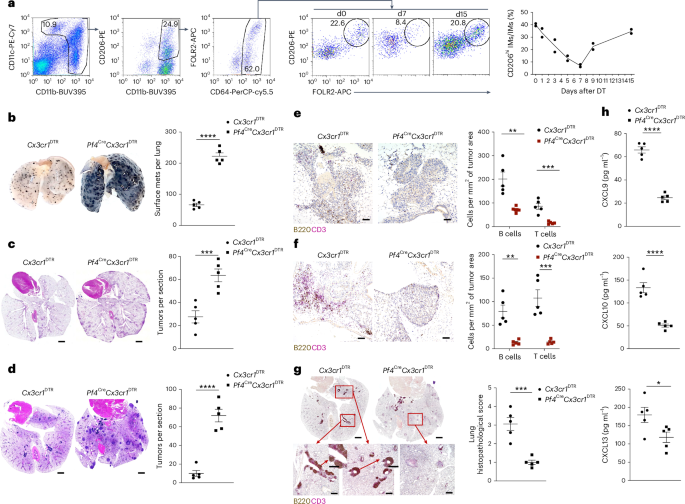
a, Representative flow cytometry plots showing the gating strategy for the identification of CD11b⁺CD64⁺CD206hi/loFOLR2+/− IMs (left) and time course analysis of the depletion of CD206hiFOLR2+ IMs at days 0, 7 and 15 (middle) and a scatter-plot showing the frequency of CD206hiFOLR2+ IM at day 0–15 (right) after intravenous injection of 700 ng DT in Pf4CreCx3cr1DTR mice. Two independent experiments, n = 2 mice per time point. b, Representative images of tumor-burdened lungs (left) and scatter-plot showing the number of surface metastases per lung (right) in Cx3cr1DTR (n = 5) and Pf4CreCx3cr1DTR (n = 5) mice at day 16 after intravenous injection of B16F10 melanoma cells. Shown is one of four independent experiments. Student’s two-tailed t-test with P < 0.0001. mets, metastases. c, Representative H&E-stained lung sections (left) and quantification of number of tumors per lung section (right) in AgerCreERT2KP mice reconstituted with Cx3cr1DTR (n = 5) and Pf4CreCx3cr1DTR (n = 5) BM. Scale bar, 1,000 µm. One of two independent experiments is shown. Student’s two-tailed t-test with P = 0.0008. d, Representative H&E-stained lung sections (left) and quantification of the number of tumors per section (right) in Cx3cr1DTR (n = 5) and Pf4CreCx3cr1DTR (n = 5) mice at day 16 post-intravenous injection of KPAR1.3 adenocarcinoma cells. Scale bar, 1,000 µm. One of four independent experiments is shown. Student’s two-tailed t-test with P < 0.0001. e, Representative immunohistochemistry images of B220 and CD3e antibodies staining (left) and quantification of B cell and T cell numbers (right) in the TME of Cx3cr1DTR (n = 5) and Pf4CreCx3cr1DTR (n = 5) mice at day 16 after intravenous injection with B16F10 melanoma cells. Scale bar, 100 µm. One of two independent experiments is shown. Student’s two-tailed t-test with P = 0.0027 (B cells) or P = 0.0006 (T cells). f, Representative immunohistochemistry images of B220 and CD3e antibodies staining (left) and quantification of B cell and T cell numbers (right) in the lungs of AgerCreERT2KP mice reconstituted with Cx3cr1DTR (n = 5) and Pf4CreCx3cr1DTR (n = 5) BM. Scale bar, 100 µm. One of two independent experiments is shown. Student’s two-tailed t-test with P = 0.0013 (B cells), P = 0.0008 (T cells). g, Representative immunohistochemistry images of B220 and CD3e antibodies staining (left) and quantification of histopathological scores (right) in the lungs of Cx3cr1DTR (n = 5) and Pf4creCx3cr1DTR (n = 5) mice at day 16 after intravenous injection of KPAR1.3 adenocarcinoma cells. Whole-lung images (stitched, scale bar 1,000 µm, top left) and magnified (×4 and ×10) views (scale bar, 100 µm, bottom left). One of three independent experiments is shown. Student’s two-tailed t-test with P = 0.0005. h, ELISA measurements of CXCL9, CXCL10 and CXCL13 in homogenized lungs from Cx3cr1DTR (n = 5) and Pf4CreCx3cr1DTR (n = 5) mice on day 16 after intravenous injection of KPAR1.3 adenocarcinoma. Two independent experiments. Student’s two-tailed t-test with P < 0.0001, P < 0.0001 and P = 0.0398. All data are represented as mean ± s.e.m. *P < 0.05; **P < 0.01; ***P < 0.001; ****P < 0.0001.
To assess the role of CD206hi IMs in tumor control, we intravenously injected melanoma (B16F10) or lung adenocarcinoma (KPAR1.3) cells into Cx3cr1DTR and Pf4CreCx3cr1DTR mice, followed by intravenous DT administration on days 3 and 7 post-tumor inoculation and quantified tumor burden at day 16. In addition, we used a primary lung adenocarcinoma model generated by crossing tamoxifen-inducible AgerCreERT2 mice, which drives Cre recombination selectively in alveolar type I epithelial cells, with KP mice, which are heterozygous for conditional oncogenic KrasG12D and carry a single floxed Trp53fl/+ allele, resulting in lung adenocarcinoma following Cre-mediated recombination (hereafter AgerCreERT2KP). To enable selective depletion of CD206hi IMs in the hematopoietic compartment, lethally irradiated AgerCreERT2KP mice were reconstituted with bone marrow (BM) from either Cx3cr1DTR (control) or Pf4CreCx3cr1DTR BM. Following 6 weeks of hematopoietic reconstitution, mice were placed on tamoxifen-containing chow for 30 days to induce Cre-mediated tumor initiation. Mice then received weekly intravenous injections of DT (500 ng per mouse) for 14 weeks, followed by tumor analysis in the lungs (Extended Data Fig. 2). In all three cancer models, DT administration in the Pf4CreCx3cr1DTR mice led to marked increased tumor burden (~3.7-fold in melanoma B16F10, 7.2-fold in lung adenocarcinoma KPAR1.3 and 2.3-fold in the spontaneous lung adenocarcinoma AgerCreERT2KP mice) relative to control Cx3cr1DTR mice (Fig. 2b–d and Supplementary Fig. 2a,b). Moreover, in the melanoma (B16F10) model, depletion of CD206hi IMs in Pf4CreCx3cr1DTR mice with a single intravenous DT dose administered on day 4 reproduced the phenotype observed with two DT doses administered on days 3 and 7 (Supplementary Fig. 2c), indicating that transient depletion of CD206hi IM after tumor seeding was sufficient to promote tumor growth.
We next used immunohistochemistry to analyze lymphocyte infiltration and TLS formation in melanoma (B16F10) and lung adenocarcinoma (KPAR1.3) transfer models, as well as in the AgerCreERT2KP spontaneous lung adenocarcinoma model. Control Cx3cr1DTR mice injected with B16F10 cells did not form visible TLS along the airways, similar with previous reports33, but had dense B220+ B cell and CD3+ T cell aggregates in the TME and peribronchial regions (Fig. 2e and Supplementary Fig. 2d). Following CD206hi IM depletion in Pf4CreCx3cr1DTR mice, B cell and T cell aggregates were markedly reduced (~80% reduction) by day 16 (Fig. 2e). In contrast, the KPAR1.3 lung adenocarcinoma transfer model and AgerCreERT2KP spontaneous mouse lung adenocarcinoma model, formed TLSs, which had compact, architecturally organized structures containing juxtaposed B220⁺ B cell clusters and CD3⁺ T cell zones (Fig. 2f,g). TLS were completely lost, along with the increased tumor burden, in the KPAR1.3 adenocarcinoma model and AgerCreERT2KP mice lung adenocarcinoma model following CD206hi IM depletion in Pf4CreCx3cr1DTR mice (Fig. 2c,d,f,g). ELISA of lung tissue from the lung adenocarcinoma KPAR1.3 model at day 16 post-tumor inoculation revealed substantial reduction in CXCL9, CXCL10 and CXCL13 protein levels (~2.7-fold, 2.6-fold and 1.5-fold, respectively) in CD206hi IM-deficient Pf4CreCx3cr1DTR mice compared to Cx3cr1DTR control mice (Fig. 2h). Together, these findings indicated that reduced lymphocyte recruitment and loss of TLS formation in CD206hi IM-depleted melanoma (B16F10) and lung adenocarcinoma (KPAR1.3) transfer models and spontaneous lung adenocarcinoma model (AgerCreERT2KP mice) were associated with accelerated tumor progression.
RecMacs and IMs establish spatial chemokine niches
We next performed spatial transcriptomic profiling on tumor-bearing lungs collected at day 16 post-cancer cell inoculation from two WT mice bearing B16F10 melanoma lung metastases and two WT mice bearing KPAR1.3 lung adenocarcinoma tumors using the 10x Xenium platform and a targeted gene panel enriched for pan leukocytes, myeloid cells, chemokines and stromal transcripts (Supplementary Figs. 3 and 4). This subcellular-resolution analysis enabled direct spatial mapping of distinct macrophage populations, including Car4+ and Chil3+ AMs, Mafb+ and C1qc+ IMs, Fn1+ and Vcan+ recMacs, together with chemokine expression and major structural components of the TME (Fig. 3a). Structural components included Acta2⁺ stromal cells demarcating tumor boundaries, Tubb3⁺ neural structures, Lyve1⁺ lymphatic vessels, Pecam1⁺ blood vessels and Epcam⁺ epithelial cells (Fig. 3a and Extended Data Fig. 3). To validate spatial registration and chemokine detection, the Xenium section also included a lung-draining lymph node from one KPAR1.3 tumor-bearing mouse, which served as an internal control. As expected, Cxcl13 was confined to the B cell zone, whereas the the DC-associated chemokines Cxcl16, Ccl17 and Ccl22 were enriched in the T cell zone (Fig. 3a and Extended Data Fig. 3), confirming accurate chemokine localization and lymph node compartmentalization34,35. Within lung tumor sections, Xenium analysis revealed that tumor nodules were delineated by Acta2 mRNA expression, which encodes α-smooth muscle actin and marks activated stromal cells, whereas H&E staining independently confirmed that these Acta2⁺ stromal structures outlined tumor regions within the lung parenchyma (Fig. 3a,b). The TME from one KPAR1.3 tumor-bearing mouse was highly innervated (Tubb3 and Nes), whereas lymphatic (Lyve1 and Pdpn), vascular (Pecam1) and epithelial (Epcam) markers were comparatively sparse (Fig. 3a and Extended Data Fig. 3). Spatial mapping showed that AMs (annotated as Car4, Chil3 and Ear1 expressing cells) were largely excluded from tumor regions, whereas DCs (Zbtb46, Flt3 and Xcr1) were distributed throughout the lung, including the TME (Fig. 3a and Extended Data Fig. 3). RecMacs, defined by Fn1, Vcan, Plac8, Clec4n and Cd9, were abundant within the TME (Fig. 3a and Extended Data Fig. 3). Based on integrated scRNA-seq clustering and protein expression analyses, Mafb+C1qc+ IMs were annotated into two major subsets: a CD206hi IM subset characterized by high expression of Folr2, Cd163 and Mmp9, and a CD206lo IM subset characterized by high expression of Mmp12 (Figs. 1d and 2a and Supplementary Fig. 5)1,3. Spatial mapping revealed that CD206hi IMs (Folr2, Cd163 and Mmp9) localized preferentially adjacent to the bronchial airways and the visceral pleura, whereas CD206lo IMs (Mmp12) and Fn1+Vcan+ recMacs predominated in tumor-dense regions (Fig. 3a).
Fig. 3: Compartmentalized IM and recMac populations organize chemokine landscapes in lung adenocarcinoma.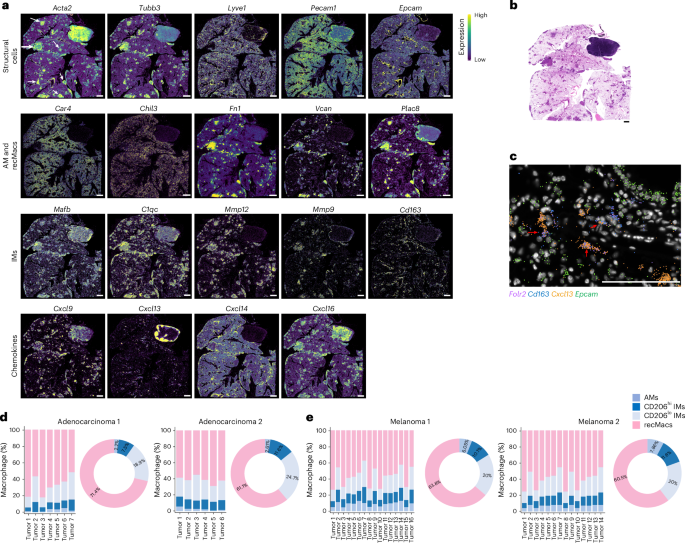
a, Xenium spatial transcriptomic analysis showing in situ gene expression of markers of structural cells (Acta2, Tubb3, Lyve1, Pecam1 and Epcam), AMs (Car4 and Chil3), recMacs (Fn1, Vcan and Plac8), IMs (Mafb, C1qc, Mmp12, Mmp9 and Cd163) and chemokines (Cxcl9, Cxcl13, Cxcl14 and Cxcl16) in the lungs of C57BL/6 WT mice at day 16 post-intravenous injection of 4 × 10⁵ KPAR1.3 adenocarcinoma cells. White arrows, activated stromal structures within the tumor microenvironment. Scale bar, 1,000 µm. b, Representative H&E-stained section of the lung of C57BL/6 WT mice at day 16 post-intravenous injection of 4 × 10⁵ KPAR1.3 adenocarcinoma cells, as in a. Scale bar, 1,000 µm. c, High-resolution imaging of spatial transcriptomics as in a showing expression of Folr2, CD163, Cxcl13 and Epcam. Red arrows highlight Cxcl13+CD206hi IMs. Scale bar, 100 µm. d,e, Spatial transcriptomics quantification of tumor associated macrophages in adenocarcinoma (n = 2) (d) or melanoma (n = 2) (e).
We next analyzed chemokine organization within the TME. Chemokine mapping revealed region-specific expression of Ccl3, Ccl4, Ccl6, Ccl7, Ccl8, Ccl9, Ccl17, Ccl22, Cxcl3, Cxcl9, Cxcl10, Cxcl13, Cxcl14 and Cxcl16 (Fig. 3a and Extended Data Fig. 3). Cxcl13 was enriched along bronchial airways coincident with Cd163⁺Folr2⁺ CD206hi IMs (Fig. 3a and Extended Data Figs. 4 and 5). In contrast, Cxcl14 localized to the outer tumor margins, whereas Cxcl16, a CXCR6 ligand associated with effector T cells and ILC2s, was concentrated in the tumor cores (Fig. 3a). High-resolution imaging indicated that CD163⁺Folr2⁺ CD206hi IMs lining Epcam⁺ bronchial epithelial airways coexpressed Cxcl13 in both the melanoma and adenocarcinoma models (Fig. 3c and Extended Data Fig. 5). Quantitative graph-based clustering of single-cell-resolved Xenium transcriptomic data was used to group cells based on transcriptional similarity, while Xenium Explorer visualization was used to validate the spatial localization of AMs, IMs and recMacs in the tumor-bearing lungs, as defined by marker-based annotation (Supplementary Figs. 3 and 4). Graph-based clustering of single-cell-resolved Xenium transcriptomic data indicated that Chil3+Ear1+Ccl6+ AMs and Cd163⁺Folr2⁺Pf4+ CD206hi IMs occupied airway- and vessel-associated niches, respectively and were less represented within the TME, whereas ~60–71% Vcan+Cx3cr1+Mafb+ recMacs and ~19–25% Mmp12+C5ar1+Mafb+CD206lo IMs of the total lung macrophages preferentially populated the tumor cores and margins (Fig. 3d,e). These data indicated a compartmentalized myeloid cell architecture that shaped the chemokine landscape and directed immune cell recruitment.
IM-derived CCL2 promotes tumor growth by recruiting recMacs
The chemokine CCL2 drives angiogenesis and monocyte recruitment16,36. The scRNA-seq analysis showed that Ccl2 was expressed by many mononuclear phagocyte populations, and Xenium spatial transcriptomics visualized Ccl2 expression throughout the TME in two WT mice bearing B16F10 melanoma lung metastases and two WT mice bearing KPAR1.3 lung adenocarcinoma (Fig. 4a,b and Extended Data Fig. 6). Furthermore, spatial transcriptomics localized expression of Ccl2 within the same tumor regions as those occupied by C1qb+ macrophages in B16F10 melanoma and KPAR1.3 adenocarcinoma-bearing lungs at day 16 post-tumor cell transfer (Fig. 4c and Extended Data Fig. 6). High-resolution imaging of Xenium transcriptomic data indicated that CD206lo IMs (Mmp12) and recMacs (Vcan) in the TME of B16F10 melanoma and KPAR1.3 adenocarcinoma-bearing lungs at day 16 coexpressed Ccl2 (Fig. 4d and Extended Data Fig. 7). To determine whether CD206hi and CD206lo IM-derived CCL2 specifically drove tumor progression, we lethally irradiated CD45.1 WT C57BL/6 mice and reconstituted them with CD45.2 WT or Ccl2−/− BM, an approach that preserves endothelial cell-derived CCL2 in the host, followed by injection with B16F10 melanoma cells 6 weeks after BM transfer. At 16 days post-B16F10 melanoma cell inoculation, BM chimeric Ccl2−/− mice showed an approximately 10.8-fold reduction in lung tumor burden and a 2.7-fold decrease in Ly6C+CD11b+ recMacs accumulation compared to BM chimeric WT mice (Fig. 4e and Supplementary Fig. 6a).
Fig. 4: Ccl2 expression by IMs is critical for the recruitment of recMacs.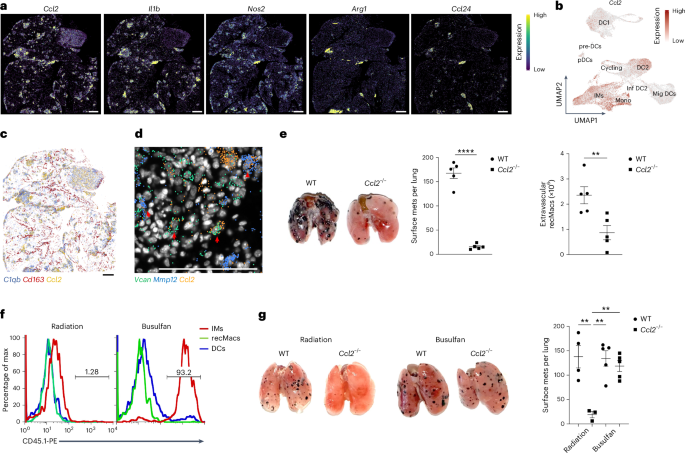
a, Xenium spatial transcriptomic analysis showing the expression of Ccl2, Il1b, Nos2, Arg1 and Ccl24 in the lungs of C57BL/6 WT mice at day 16 post-intravenous injection of 4 × 10⁵ KPAR1.3 adenocarcinoma cells. b, UMAP visualization of Ccl2 expression in myeloid cells as in Fig. 1a. c, Spatial transcriptomics as in a showing the overlay of C1qb, Cd163 and Ccl2. Scale bar, 1,000 µm. d, High-resolution imaging of spatial transcriptomics as in a showing the expression of Vcan, Mmp12 and Ccl2 within the TME. Red arrows show Ccl2+ CD206lo IMs and Ccl2+ recMacs. Scale bar, 100 µm. e, Representative lung images (left), quantification of surface metastases (middle) and recMacs per lung (right) in mice reconstituted with CD45.2 WT (n = 5) or Ccl2−/− (n = 5) BM on day 16 post-intravenous injection with B16F10 melanoma cells. One of three independent experiments is shown. Statistical significance determined using Student’s two-tailed t-test P < 0.0001 (metastases), P = 0.0097 (recMacs). f, Histogram showing expression of CD45.1 in CD11b+CD64+ IMs, Ly6C+CD11b+ recMacs or CD11c+MHCII+CD64− DCs in C57BL/6 CD45.1 WT mice that were injected intraperitoneally with 25 mg kg−1 busulfan or lethally (900 rad) irradiated, reconstituted with WT CD45.2 BM and analyzed at 4 weeks after busulfan or 6 weeks after lethal irradiation. Three independent experiments with n = 3 mice per group. g, Representative lung images (left) and quantification of surface metastases (right) in irradiated or busulfan-conditioned C57BL/6 CD45.1 WT mice as in f reconstituted with WT (radiation, n = 4; busulfan, n = 5) or Ccl2−/− (radiation, n = 3; busulfan, n = 5) BM at day 16 post-intravenous injection of B16F10 melanoma cells. One of two independent experiments is shown. Statistical significance was determined via one-way analysis of variance (ANOVA) followed by Bonferroni’s multiple comparisons test with P = 0.0012 (radiation WT versus radiation Ccl2−/−), P = 0.001 (radiation Ccl2−/− versus busulfan WT) and P = 0.0034 (radiation Ccl2−/− versus busulfan Ccl2−/−). All data are represented as mean ± s.e.m. **P < 0.01; ****P < 0.0001.
Because lethal irradiation resulted in complete replacement of the host myeloid compartment by BM donor-derived cells, irradiated mice reconstituted with Ccl2−/− BM lacked CCL2 expression across all mononuclear phagocyte populations, including IMs, recMacs and DCs. To selectively preserve CCL2 expression by long-lived, tissue-resident IMs, while eliminating CCL2 production from short-lived circulating myeloid populations such as recMacs and DCs, we used conditioning with busulfan, which depletes hematopoietic progenitors and circulating myeloid cells while sparing long-lived IMs. CD45.1 WT recipients that were either treated intraperitoneally with 25 mg kg−1 busulfan or lethally irradiated were reconstituted with either CD45.2 WT or CD45.2 Ccl2−/− BM. Four weeks after Ccl2−/− BM transfer in the busulfan-treated mice, flow cytometric analysis of lung tissue using CD45.1 (host) and CD45.2 (donor) congenic markers indicated that CD11b⁺CD64⁺ IMs were predominantly CD45.1 WT host-derived and retained CCL2 expression, whereas Ly6C⁺CD11b⁺ recMacs and CD11c⁺MHCII⁺CD88⁻ DCs were CD45.2 Ccl2−/− donor-derived and therefore lacked CCL2 expression (Fig. 4f). In contrast, irradiation resulted in BM donor-derived replacement of all mononuclear phagocyte populations (Fig. 4f). Consistent with this reconstitution pattern, CCL2-producing IMs were detected in busulfan-treated BM chimeric mice but were absent in irradiated BM chimeric mice reconstituted with Ccl2−/− BM (Fig. 4f).
When irradiated mice and busulfan-treated mice were intravenously injected with B16F10 melanoma cells at 6 weeks or 4 weeks post-conditioning, respectively, and lung metastases were quantified at day 16 post-tumor inoculation, irradiated BM chimeric mice reconstituted with Ccl2−/− BM exhibited a 7.0-fold reduction in lung metastatic burden compared to busulfan-treated BM chimeric mice reconstituted with Ccl2−/− BM (Fig. 4e,g). In contrast, busulfan-treated Ccl2−/− BM chimeric mice, which retained CCL2-producing IMs but lacked CCL2 production by recMacs and DCs, exhibited metastatic tumor growth comparable to busulfan-treated WT BM chimeric mice and irradiated WT BM chimeric mice (Fig. 4g and Supplementary Fig. 6b). Together, these data demonstrated that IM-derived CCL2, rather than endothelial, recMac or DC derived CCL2, was required for recMac recruitment and the progression of B16F10 melanoma lung metastasis model.
MoDCs suppress vaccine-induced antitumor immunity
Ly6C+CD11b+ recMacs migrate to the draining lymph nodes, where they differentiate into moDCs that function as antigen-presenting cells and induce antigen-specific regulatory T cells that limit DC-driven type 2 inflammation and cytotoxic T cell responses against tumors15,16,37. moDCs depend on CCR5-CCL5 signaling, rather than on CCR7, for entry into the lymph node15. UMAP analysis of the scRNA-seq dataset from the extravascular CD64+CD11b+ mononuclear phagocytes as above indicated expression of Ccr5 in Ly6c2⁺ recMacs and Ccl5 expression in Ccr7⁺ migratory DCs (Fig. 5a). Spatial transcriptomic analysis of lung-draining lymph nodes from mice injected with KPAR1.3 adenocarcinoma cells further indicated that Ccl5 expression was localized in the Cd3+ T cell zone, where migratory DCs reside (Fig. 5b). To test whether CCR5-dependent moDC migration elicited an immunosuppressive function in cancer, we set up competitive mixed BM chimera to selectively disrupt CCR5 expression in monocyte-derived cells while preserving CCR5 expression in other lineages37. To set up competitive BM chimeras that could test the functional contribution of CCR5⁺ moDCs, independent of effects on conventional DCs, lethally irradiated CD45.2 C57BL/6 WT recipient mice were reconstituted with mixed whole BM consisting of 80% Ccr2−/− to 20% WT BM or 80% Ccr2−/− to 20% Ccr5−/− BM. In this competitive setting, CCR2-sufficient BM cells outcompete CCR2-deficent cells in the reconstitution of CCR2-dependent cell types, resulting in the complete repopulation of lymph node monocytes by Ccr5−/–derived BM cells (or WT BM cells in the control mice)37. In contrast, DCs, which do not depend on CCR2 for tissue or lymph node migration, are reconstituted according to the original BM input ratio, thereby maintaining normal functional DC representation across groups37. Because DCs do not require CCR2 or CCR5 to enter the lymph nodes37, this experimental setup could test the role of CCR5⁺ moDCs, and implicitly Ly6C+CD11b+ recMacs, in the B16F10 melanoma and KPAR1.3 lung adenocarcinoma models. Six weeks after BM reconstitution, mice were intravenously injected with B16F10 melanoma or KPAR1.3 lung adenocarcinoma cells, and lung metastases were quantified at day 16 post-tumor inoculation. Chimeric mice reconstituted with 80% Ccr2−/− to 20% Ccr5−/− BM, which lacked CCR5 expression in monocyte-derived cells, had a 6.8-fold reduction in lung metastatic melanoma burden and a 9.3-fold reduction in lung adenocarcinoma burden compared to 80% Ccr2−/− to 20% WT control chimeric mice (Fig. 5c,d and Supplementary Fig. 7a,b). These data demonstrated that CCR5 expression in monocyte-derived cells was required to support lung tumor growth in both the B16F10 melanoma and KPAR1.3 adenocarcinoma models.
Fig. 5: Maraviroc enhances neoantigen vaccine immunity by blocking moDC migration to draining lymph nodes.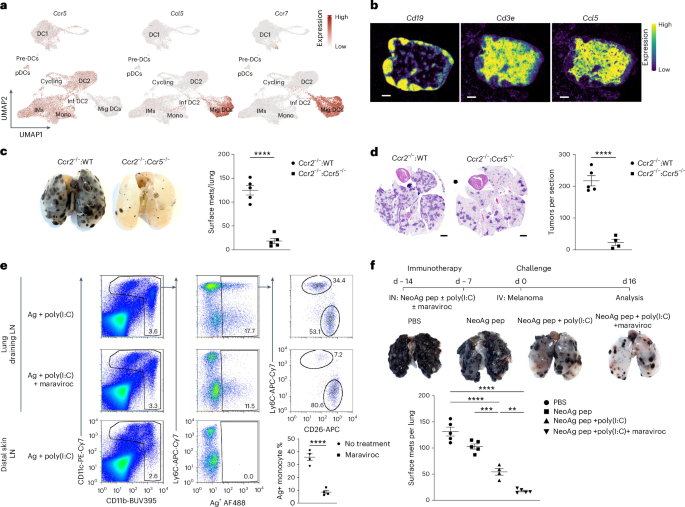
a, UMAP visualization of Ccr5, Ccl5 and Ccr7 expression in myeloid cells as in Fig. 1a. b, Xenium spatial transcriptomics expression of Cd19, Cd3e and Ccl5 in the lung-draining lymph nodes from C57BL/6 WT mice on day 16 post-intravenous injection of 4 × 10⁵ KPAR1.3 adenocarcinoma cells. Scale bar, 100 µm. c, Representative lung images (left) and quantification of surface metastases (right) in lethally irradiated C57BL/6 WT mice reconstituted with Ccr2−/−:WT (80:20) or Ccr2−/−:Ccr5−/− (80:20) BM on day 16 post-intravenous injection with B16F10 melanoma cells. One of two independent experiments with n = 5 mice per group is shown. Statistical significance was determined via a Student’s two-tailed t-test with P < 0.0001. d, Representative H&E staining (left) and quantification of the number of tumors per section (right) in the lungs of Ccr2−/−:WT (80:20) (n = 5) and Ccr2−/−:Ccr5−/− (80:20) (n = 4) mixed BM chimeras as in c on day 16 post-intravenous injection with KPAR adenocarcinoma cells. Two independent experiments were conducted. Statistical significance was determined via a Student’s two-tailed t-test with P < 0.0001. e, Representative flow cytometry plots showing the gating strategy for the identification of antigen (Ag)+ Ly6C⁺ moDCs and CD26⁺ DCs (top, left to right) and quantification of the frequency of Ag+ monocytes (bottom right) in the lung-draining lymph nodes of WT mice treated with or without 500 μg maraviroc 3 h before intranasal administration of 5 μg OVA Ag + 50 μg poly(I:C) (top and middle) or nondraining distal skin lymph nodes from mice receiving 5 μg OVA Ag + 50 μg poly(I:C) without maraviroc (bottom) and analyzed 24 h post-antigen administration. Three independent experiments were conducted with n = 4 per group. Statistical significance was determined via a Student’s two-tailed t-test with P < 0.0001. f, Schematics showing the experimental flow (top), representative lung images (middle) and number of surface metastases per lung (bottom) in WT mice treated with PBS (n = 5), neoantigen (NeoAg) peptides (n = 5), NeoAg peptides + poly(I:C) (n = 4) or NeoAg peptides + poly(I:C) + maraviroc (n = 5) on day 14 and 7 before intravenous injection with B16F10 melanoma cells and analyzed on day 16 post-tumor injection. Two independent experiments were conducted. Statistical significance was determined via one-way ANOVA followed by Bonferroni’s multiple comparison test with P = 0.0035 (NeoAg + poly(I:C) versus NeoAg + poly(I:C) + maraviroc). All data are represented as mean ± s.e.m. **P < 0.01; ***P < 0.001; ****P < 0.0001.
To define the functional contribution of antigen-bearing Ly6C⁺ moDCs15, we transiently blocked CCR5-dependent moDC migration using the small-molecule CCR5 antagonist maraviroc during DC-based vaccination. To measure directly the effects of maraviroc on the migration of antigen-bearing Ly6C⁺ moDCs to the lung-draining lymph nodes, WT C57BL/6 mice were injected intraperitoneally with maraviroc or vehicle, followed 3 h later by intranasal administration of fluorescently labeled ovalbumin (OVA)+poly(I:C). At 24 h after antigen delivery, both antigen-bearing CD26⁺ DCs and Ly6C⁺ moDCs were detected in the lung-draining lymph nodes (Fig. 5e); however, mice treated with maraviroc exhibited an approximately 76% reduction in antigen-bearing Ly6C⁺ moDCs compared to vehicle-treated mice (Fig. 5e)15, indicating impaired moDC migration without affecting DC migration. To determine the duration of CCR5 blockade, maraviroc was administered 3, 24 or 48 h before intranasal OVA+poly(I:C) delivery. Inhibition of antigen-bearing Ly6C⁺ moDC migration was observed only when maraviroc was administered 3 h before antigen delivery, but not at 24 or 48 h (Extended Data Fig. 8), indicating that CCR5 blockade was transient. This temporal restriction is consistent with the reported short half-life of maraviroc (~16 h)38.
Based on these kinetics, we next examined whether blocking migration of antigen-bearing Ly6C⁺ moDC during the priming phase of DC-based cancer vaccination altered antitumor immunity. Mice were injected intraperitoneally with maraviroc or vehicle and vaccinated 3 h later with melanoma neoantigen peptides+poly(I:C). Control groups received neoantigen peptides without poly(I:C) or were left unvaccinated. Mice were then challenged intravenously with B16F10 melanoma cells, and lung metastases were quantified at day 16 post-tumor inoculation. Mice that received neoantigen peptides+ poly(I:C) together with maraviroc exhibited a 7.5-fold reduction in metastatic burden compared to unvaccinated mice and a 3.1-fold reduction compared to mice vaccinated with neoantigen peptides+poly(I:C) without maraviroc (Fig. 5f and Supplementary Fig. 7c). These data indicated that Ly6C⁺ moDCs in the draining lymph node acted as immunosuppressive antigen-presenting cells during early vaccination and that transient CCR5 blockade during this defined window enhanced the efficacy of DC-based neoantigen vaccination.