
Investors may be wondering if Ulta Beauty, at around US$532.79, is offering good value right now or if recent excitement has already been priced in. The stock has pulled back over the short term, with a 0.9% decline over 7 days and a 17.7% decline over 30 days. Even so, it still shows a 50.1% return over the past year and 63.3% over 5 years. Recent coverage has focused on Ulta Beauty as a key name in specialty retail and on how the share price has shifted after a strong multi year run. This context has pushed valuation questions to the forefront for investors who are weighing long term performance against more recent price moves. Ulta Beauty currently holds a valuation score of 2 out of 6. Next up is a look at how different valuation methods assess the stock today and why looking beyond simple metrics can give you a sharper view of what that score really means.
Ulta Beauty scores just 2/6 on our valuation checks. See what other red flags we found in the full valuation breakdown.
Approach 1: Ulta Beauty Discounted Cash Flow (DCF) Analysis
A Discounted Cash Flow, or DCF, model estimates what a business could be worth today by projecting its future cash flows and then discounting those projections back to a present value.
For Ulta Beauty, the model used is a 2 Stage Free Cash Flow to Equity approach. The latest twelve month Free Cash Flow stands at about $1.06b. Analysts provide specific forecasts for the next few years. Beyond that, Simply Wall St extrapolates cash flows out to 2035, with projected Free Cash Flow of $1.27b in 2030 and further estimated values thereafter.
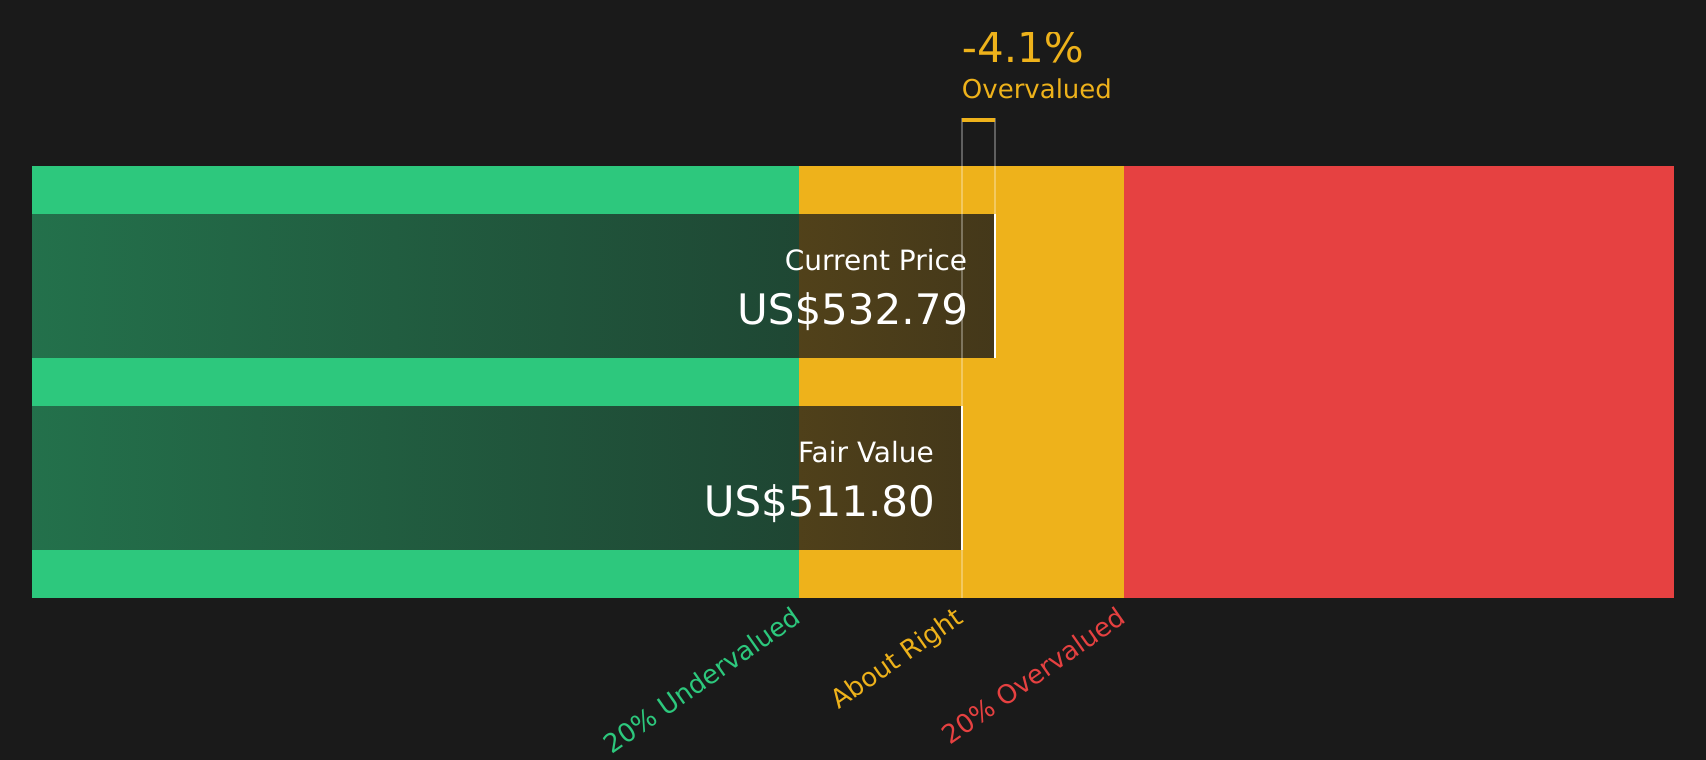
Using these cash flow projections and discounting them, the DCF model arrives at an estimated intrinsic value of about $511.79 per share. Against the recent share price of around $532.79, this implies the stock is about 4.1% overvalued, which is a relatively small gap.
Put simply, the DCF suggests Ulta Beauty is trading close to what the model estimates it is worth today.
Result: ABOUT RIGHT
Ulta Beauty is fairly valued according to our Discounted Cash Flow (DCF), but this can change at a moment’s notice. Track the value in your watchlist or portfolio and be alerted on when to act.
 ULTA Discounted Cash Flow as at Apr 2026
Approach 2: Ulta Beauty Price vs Earnings
For a profitable company, the P/E ratio is a useful yardstick because it links what you pay directly to the earnings generated per share. Investors usually expect higher P/E ratios when they see stronger earnings growth potential or lower perceived risk, and lower P/E ratios when growth expectations or confidence are weaker.
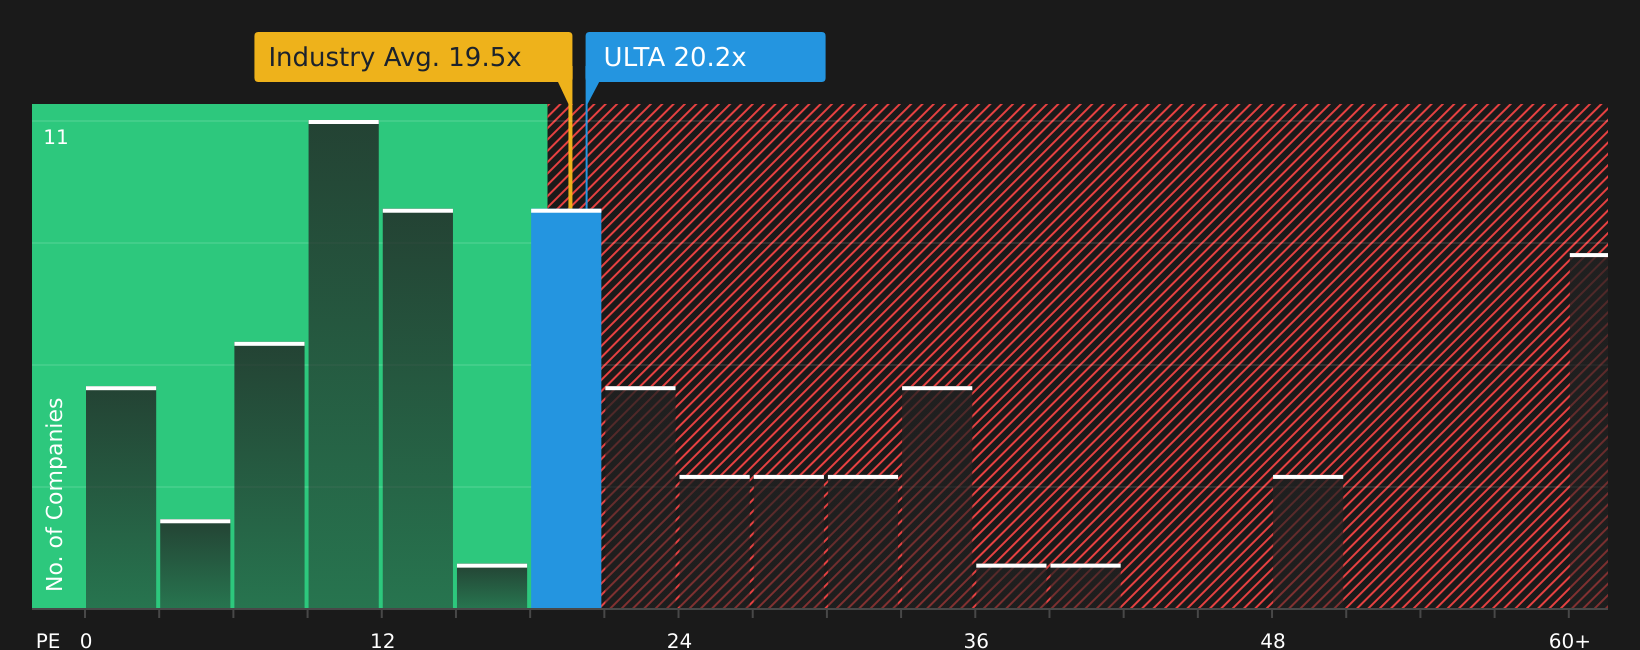
Ulta Beauty currently trades on a P/E of about 20.20x. This sits slightly above the Specialty Retail industry average P/E of 19.51x, yet below the peer group average of 31.88x. This shows that some comparable companies trade at materially higher earnings multiples. Simply Wall St also calculates a proprietary “Fair Ratio” for Ulta Beauty of 17.12x, which represents the P/E level suggested by factors such as its earnings growth profile, industry, profit margins, market cap and risk characteristics.
This Fair Ratio can be more informative than a simple peer or industry comparison because it is tailored to Ulta Beauty’s own fundamentals rather than broad group averages. Comparing the current P/E of 20.20x with the Fair Ratio of 17.12x points to a valuation that is somewhat richer than that model implies.
Result: OVERVALUED
 NasdaqGS:ULTA P/E Ratio as at Apr 2026
P/E ratios tell one story, but what if the real opportunity lies elsewhere? Start investing in legacies, not executives. Discover our 19 top founder-led companies.
Upgrade Your Decision Making: Choose your Ulta Beauty Narrative
Earlier it was mentioned that there is an even better way to understand valuation, so Narratives are introduced as a simple tool that lets you attach a clear story about Ulta Beauty to numbers like fair value, future revenue, earnings and margins. You can then see that story play out in a financial model on Simply Wall St’s Community page, where Narratives are updated when new news or earnings arrive. For example, one Ulta Beauty Narrative sees international expansion, loyalty and wellness initiatives supporting a higher fair value closer to US$810.00. Another, more cautious Narrative, focused on margin pressure and competition, points to a lower fair value around US$415.28. This gives you a way to compare those fair values to the current share price and decide for yourself whether the stock looks closer to a buy, a hold, or a sell.
For Ulta Beauty however, we will make it really easy for you with previews of two leading Ulta Beauty Narratives:
 Ulta Beauty Bull Case
Fair value in this narrative: US$684.38 per share
Implied discount to fair value vs last close: about 22% undervalued
Revenue growth assumption: 6.36%
Sees wellness, exclusive brands and a curated marketplace as key drivers of customer appeal and margins over time. Relies on digital upgrades, a large loyalty base and international expansion into markets like the UK, Mexico and the Middle East to support earnings power. Still flags risks around rising costs, the Target partnership ending in 2026 and intense competition that could pressure margins and growth.
 Ulta Beauty Bear Case
Fair value in this narrative: US$427.41 per share
Implied premium to fair value vs last close: about 25% overvalued
Revenue growth assumption: 4.5%
Highlights Ulta’s strong margins, buybacks, private label brands and a debt free balance sheet, but questions how much growth is left in a mature US store base. Points to execution risk as e commerce and other retailers compete for beauty spending, especially in areas already crowded with stores. Frames perceived undervaluation as relying heavily on multiple expansion, suggesting limited edge if growth and margins slow over time.
Once you have seen both sides laid out, you can decide which narrative feels closer to your own expectations and then stress test the assumptions yourself using the full Community Narratives on Simply Wall St.
To see how these results tie into long-term growth, risks, and valuation, check out the full range of community narratives for Ulta Beauty on Simply Wall St. Add the company to your watchlist or portfolio so you’ll be alerted when the story evolves.
Do you think there’s more to the story for Ulta Beauty? Head over to our Community to see what others are saying!
 NasdaqGS:ULTA 1-Year Stock Price Chart
This article by Simply Wall St is general in nature. We provide commentary based on historical data
and analyst forecasts only using an unbiased methodology and our articles are not intended to be financial advice. It does not constitute a recommendation to buy or sell any stock, and does not take account of your objectives, or your
financial situation. We aim to bring you long-term focused analysis driven by fundamental data.
Note that our analysis may not factor in the latest price-sensitive company announcements or qualitative material.
Simply Wall St has no position in any stocks mentioned.
New: AI Stock Screener & Alerts
Our new AI Stock Screener scans the market every day to uncover opportunities.
• Dividend Powerhouses (3%+ Yield)
• Undervalued Small Caps with Insider Buying
• High growth Tech and AI Companies
Or build your own from over 50 metrics.
Have feedback on this article? Concerned about the content? Get in touch with us directly. Alternatively, email editorial-team@simplywallst.com


