


Robust humoral immunity against HCoV is seen across the lifecourse and is boosted by SARS-CoV-2 infection or vaccination
Blood samples were obtained from staff and residents within LTCFs and split into four cohorts on the basis of prior infection and/or vaccination with SARS-CoV-2: uninfected/unvaccinated (n = 124), uninfected/vaccinated (n = 24), infected/unvaccinated (n = 152), and infected/vaccinated (n = 69) (Table 1; Supplementary Data 1). Primary series vaccination was undertaken with BNT162b2 (Pfizer-BioNtech) or ChAdOx1 vaccines and booster vaccination with BNT162b2.
Initial studies focused on IgG titre against spike protein from SARS-CoV-2 and the four endemic coronaviruses (OC43, HKU1, NL63, 229E) (Fig. 1).
Fig. 1: Antibody titre against spike from SARS-CoV-2 and HCoV in relation to SARS-CoV-2 infection and vaccination status. The alternative text for this image may have been generated using AI.
Spike-specific IgG titre against SARS-CoV-2, OC43, HKU1, NL63 and 229E in SARS-CoV-2-seronegative unvaccinated donors (a, n = 124), SARS-CoV-2-seropositive unvaccinated donors (b, n = 152), SARS-CoV-2-seronegative vaccinated donors (c, n = 24) and SARS-CoV-2-seropositive vaccinated donors (d, n = 69). Kruskal–Wallis (Dunn’s multiple comparisons test). Black lines indicate median titre and interquartile range, dotted black line indicates the cutoff. Correlation of age with Spike-specific IgG titre against SARS-CoV-2 (black), OC43 (blue) and HKU1 (green) in seronegative unvaccinated donors (e, n = 124), seropositive unvaccinated donors (f, n = 152), seronegative vaccinated donors (g, n = 24) and seropositive vaccinated donors (h, n = 69). The Spearman correlation coefficient (r) and P-values are shown. Fitted lines are linear regressions. No age-related correlations were observed with HCoVs (Supplementary Fig. 2). i Fold change in median SARS-CoV-2 spike IgG titre in seropositive unvaccinated (light red), seronegative vaccinated (black) and seropositive vaccinated (red) donors in relation to seronegative unvaccinated donors. Fold changes are listed. j Fold change in median OC43, HKU1, NL63 and 229E spike-specific IgG in seropositive unvaccinated (light red), seronegative vaccinated (black) and seropositive vaccinated (red) donors in relation to seronegative unvaccinated donors (grey). Fold changes are listed, black dotted line denotes a fold change of 1. Source data: Supplementary Data 1.
As expected, SARS-CoV-2 uninfected and unvaccinated donors exhibited low levels of SARS-CoV-2 spike IgG antibodies, although positive values were observed in a few cases (Fig. 1a), most notably in older donors and potentially indicating an increase in spike protein cross-reactivity with age (Fig. 1e, p = 0.04). High baseline levels of spike-specific antibody towards the four endemic coronaviruses were observed in all donors, with OC43 and 229E being particularly immunodominant.
The increment in spike-specific IgG titre against each virus after SARS-CoV-2 infection or vaccination was next assessed by relative fold-change increase, calculated as the median AU/ml values within the ‘Infection’, ‘Vaccine’ and ‘Hybrid Immunity’ groups divided by the median AU/ml value within the ‘Pre-SARS-CoV-2’ group. SARS-CoV-2 infection boosted SARS-CoV-2-specific spike IgG titre by 117-fold (Fig. 1b, i) together with a 1.7-fold and 1.8-fold increment against betacoronavirus OC43 and HKU1 spike protein (Fig. 1j) but no increase against alphacoronaviruses. Of note, SARS-CoV-2-specific antibody titre remained lower than that seen against OC43 or 229E.
In comparison to infection, antibody responses against all coronaviruses were increased much more markedly in vaccinees, with fold-titre increases of 1960, 2.9, 1.9, 1.3 and 1.4 against SARS-CoV-2, OC43, HKU-1, NL63 and 229E respectively (Fig. 1c). These values were further extended by ‘hybrid’ infection-vaccine immunity with increments of 7070, 4.5, 4.2, 2.8 and 2.1 respectively (Fig. 1d, j).
These data show that strong humoral immunity against HCoV is seen across the life course with a distinct pattern of immunodominance. SARS-CoV-2 infection elicits a humoral response of moderate magnitude compared to that against HCoV, but this is extended 60-fold by primary series vaccination.
SARS-CoV-2 and HCoV spike-specific titre correlate differentially at different stages of exposure to SARS-CoV-2
The correlation between SARS-CoV-2 and HCoV antibody titre within individual donors was next examined in relation to SARS-CoV-2 infection or vaccination status (Fig. 2).
Fig. 2: SARS-CoV-2 and HCoV spike-specific titre correlate differentially at different stages of exposure to SARS-CoV-2.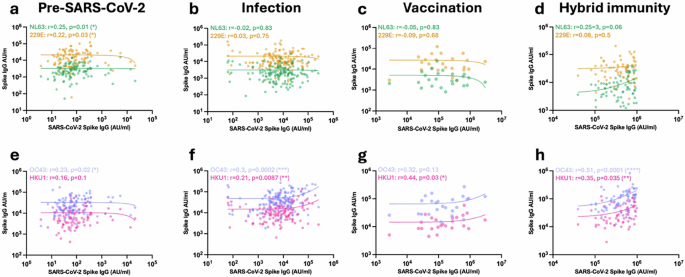 The alternative text for this image may have been generated using AI.
Correlation of SARS-CoV-2 spike IgG titre with alphacoronavirus spike (NL63 (green) and 229E (yellow), a–d) and betacoronavirus spike (OC43 (purple) and HKU1 (pink), e–h) IgG titres in seronegative unvaccinated donors (a, n = 124), SARS-CoV-2-seropositive unvaccinated donors (b, n = 152), SARS-CoV-2-seronegative vaccinated donors (c, n = 24) and SARS-CoV-2-seropositive vaccinated donors (d n = 69). The Spearman correlation coefficient (r) and P-values are shown. Source data: Supplementary Data 1.
Prior to SARS-CoV-2 infection or vaccination, the background antibody response against SARS-CoV-2 was correlated with antibody titres against all HCoVs except HKU1, indicating modest humoral cross-reactivity within the coronavirus family. Subsequent infection strongly increased this correlation with the betacoronaviruses, whilst that with alphacoronaviruses was lost. Of interest, no correlation was observed following vaccination in infection-naive donors, whilst this pattern was clearly established in donors with hybrid immunity.
These data indicate that antibody responses against most coronaviruses show some degree of cross-reactivity with SARS-CoV-2 prior to infection, whilst the correlation with antibodies against betacoronaviruses is strongly enhanced by infection but not vaccination.
Antibodies against betacoronavirus HCoV can cross-react with the S2 domain of SARS-CoV-2
As spike-specific antibody titres against HCoV betacoronaviruses were enhanced preferentially compared to alphacoronaviruses following SARS-CoV-2 infection or vaccination, we next examined to what extent this increment was able to bind to SARS-CoV-2 spike or if it represented non-crossreactive ‘backboosting’. We were also interested to determine the relative importance of the S1 and S2 domains in cross-reactive recognition. To assess this, plasma from donors with prior SARS-CoV-2 infection was incubated with recombinant S1 or S2 SARS-CoV-2 spike domain protein. This pre-adsorbed plasma was then assessed for ability to bind to the spike domain of each HCoV.
As expected, antibody binding to SARS-CoV-2 spike was lost following adsorption with S1 and S2 domain. Preadsorption with S1 domain alone reduced total spike binding by 35% but this increased to 93% in vaccinated donors. As such, vaccination strongly biases the antibody response towards the S1 domain. (Fig. 3a, unvaccinated p = 0.0004, vaccinated p < 0.0001).
Fig. 3: SARS-CoV-2 vaccination focusses antibody production against SARS-CoV-2 S1 domain whilst HCoV cross-reactive antibodies bind to the S2 domain.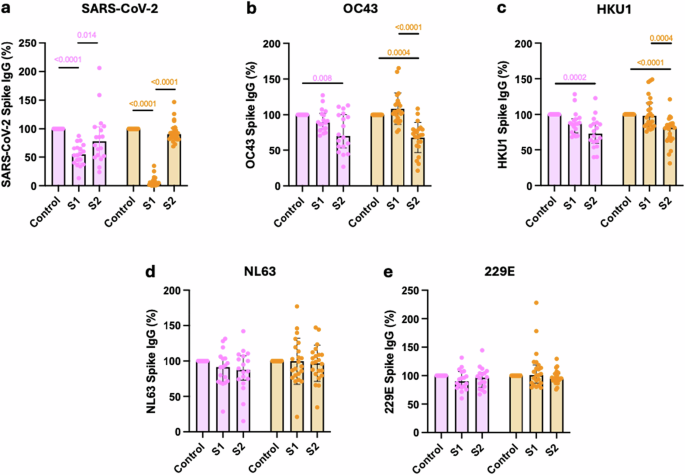 The alternative text for this image may have been generated using AI.
SARS-CoV-2 (a), OC43 (b), HKU1 (c), NL63 (d) and 229E (e) spike-specific IgG binding from unvaccinated (pink, n = 18) or vaccinated (orange, n = 23) SARS-CoV-2-seropositive donors following pre-adsorption with either S1 or S2 domains from SARS-CoV-2 Spike protein. Data are expressed as a percentage compared to binding within the unadsorbed control (Control). Friedman test with Dunn’s multiple comparison test was used. Source data: Supplementary Data 1.
In contrast, the cross-reactive antibody response between SARS-CoV-2 and the OC43 and HKU1 HCoVs was largely focussed against the S2 domain (Fig. 3b, c).
Antibody binding to alphacoronaviruses NL63 or 229E was not reduced by SARS-CoV-2 spike preadsorption. As such, the increment in this titre that arises following SARS-CoV-2 vaccination or hybrid immunity must reflect backboosting of NL63 or 229E-selective B cells (34 d, 3e).
Cellular responses against SARS-CoV-2 preferentially target S1 spike domain whilst HCoV-specific responses are largely S2 focussed
We next went on to determine the relative magnitude and specificity of the cellular response to spike peptides from SARS-CoV-2 and HCoV. PBMC were isolated from donors with prior SARS-CoV-2 vaccination and assessed in a quantitative IFNγ and IL-2 FluoroSpot assay utilising overlapping peptide pools from the S1 and S2 domains of the spike protein from SARS-CoV-2, OC43, HKU1, NL63 or 229E (Fig. 4).
Fig. 4: Cellular response to SARS-CoV-2 and HCoV measured by FluoroSpot.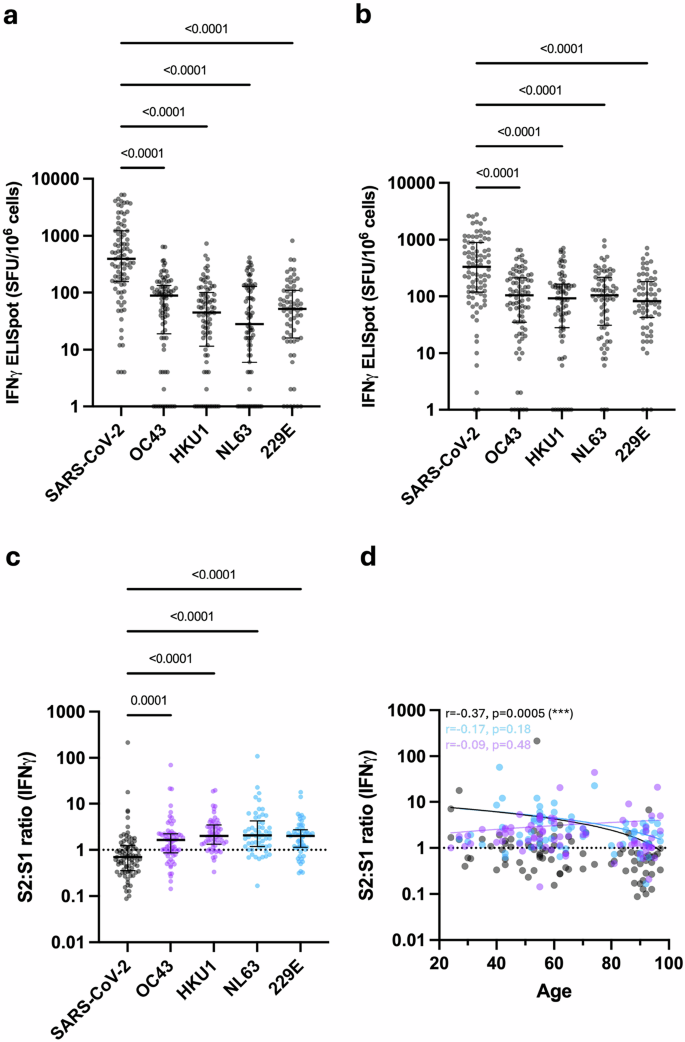 The alternative text for this image may have been generated using AI.
a IFNγ FluoroSpot response to SARS-CoV-2 and HCoV S1 peptide stimulation (n = 66–87). Kruskal–Wallis (Dunn’s multiple comparisons test). Black lines indicate the median and interquartile range. b IFNγ FluoroSpot response to SARS-CoV-2 and HCoV S2 peptide stimulation (n = 64–86). Kruskal–Wallis (Dunn’s multiple comparisons test). Black lines indicate the median and interquartile range. c Ratio of S2-specific to S1-specific IFNγ cellular responses in SARS-CoV-2 and HCoV (n = 54–84). Betacoronaviruses are indicated with purple dots, and alphacoronaviruses are indicated with blue dots. Kruskal–Wallis (Dunn’s multiple comparisons test). Black lines indicate the median and interquartile range. d Ratio of S2-specific to S1-specific IFNγ cellular responses to SARS-CoV-2 (black dots, n = 84), alphacoronaviruses NL63 and 229E (blue dots, n = 66) and betacoronaviruses OC43 and HKU1 (purple dots, n = 74) in relation to age. Dotted black line indicates a S2:S1 ratio of 1. The Spearman correlation coefficient and P-values are shown. Fitted lines are linear regressions. Source data: Supplementary Data 1.
Spike-specific cellular responses were substantially higher against SARS-CoV-2 compared to HCoV, regardless of SARS-CoV-2 infection status, and broadly comparable against S1 and S2 domains (Fig. 4a, b, p < 0.0001). In contrast, a discordant pattern of relative immunity against S1 and S2 peptides was observed for HCoVs. Relative immunodominance against HCoV S1 was comparable to that observed for humoral immunity, with OC43 > 229E > HKU1 > NL63. However, cellular responses against peptides from S2 were broadly comparable across all HCoV. To assess this profile further, cellular responses to peptides from S2 or S1 were expressed as a ratio. The median S2:S1 ratio was 0.69 for SARS-CoV-2 but increased to 1.6, 2.0, 2.1 and 2 for OC43, HKU1, NL63 and 229E, respectively (Fig. 4c, p = 0.0001- < 0.0001, Supplementary Fig. 3c). S2:S1 ratio in relation to age showed that older people have comparatively stronger cellular responses to S1 peptides from SARS-CoV-2 (Fig. 4d, r = −0.37, p = 0.0005). No significant trends pertaining to age were observed for HCoV.
These findings demonstrate that cellular responses to SARS-CoV-2 preferentially target the S1 spike domain following vaccination, whilst cellular responses to HCoV are focussed against S2.
T cell recognition of human betacoronaviruses elicits a common cytokine profile of IFNγ, IL-2 and CXCL8 production
The functional capacity of coronavirus-specific T cells was further assessed by analysis of the profile of cytokine production following peptide stimulation. IFNγ and IL-2 production had been determined by FluoroSpot, and this was extended using LEGENDplex analysis of eluates from FluoroSpot plates following spike peptide stimulation. Given the importance of age as a risk factor for coronavirus infection, these assays were undertaken in donors aged over 65 years with prior SARS-CoV-2 infection (Fig. 5; Supplementary Data 2).
Fig. 5: Profile of cytokine production following cellular recognition of spike peptides from betacoronaviruses.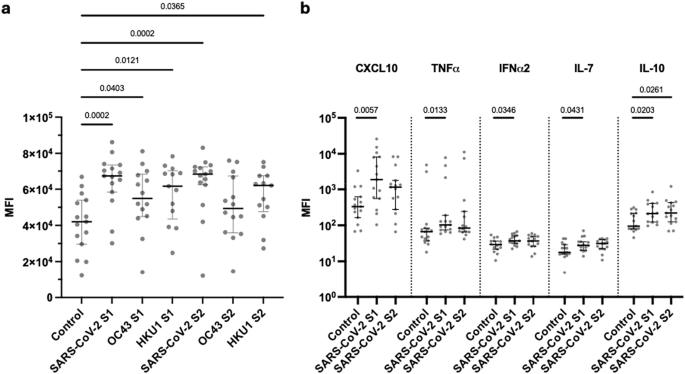 The alternative text for this image may have been generated using AI.
a Mean fluorescence intensity (MFI) of CXCL8 within FluoroSpot eluates after stimulation with either S1 or S2 spike peptides from SARS-CoV-2 or OC43 and HKU1 compared to DMSO control. Donors were SARS-CoV-2 vaccinated donors and >65 years of age (n = 15). Kruskal–Wallis (uncorrected Dunn’s test). Black lines indicate the median MFI with interquartile range. b Mean fluorescence intensity (MFI) of CXCL10, TNFɑ, IFN-ɑ2, IL-7 and IL-10 within FluoroSpot eluates after stimulation with SARS-CoV-2 S1 or S2 peptides compared to a DMSO control in vaccinated donors over the age of 65 (n = 15). Kruskal–Wallis (uncorrected Dunn’s test). Black lines indicate the median MFI with interquartile range. Source data: Supplementary Data 2.
A striking observation was that concentrations of CXCL8 were markedly increased following stimulation with S1 or S2 spike peptides from betacoronaviruses (Fig. 5a). CXCL10, TNFɑ, IFNɑ2, IL-7 and IL-10 were also elevated following SARS-CoV-2 S1 stimulation, whilst IL-10 increased following stimulation with peptides from S2. (Fig. 5b). These cytokines were not elevated following recognition of peptides from HCoV (Supplementary Fig. 4).