


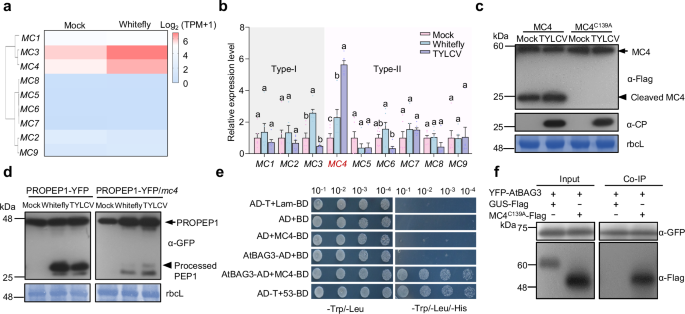
MC4 is activated by herbivory and shifts substrate preference upon viral infection
To investigate whether biotic stress, particularly the piercing-sucking feeding behavior of whiteflies, activates MC4, we examined the expression patterns of MCs. RNA sequencing revealed a marked upregulation of Arabidopsis MC4 expression following whitefly infestation (Fig. 1a). This upregulation was further confirmed by quantitative RT-PCR (qRT-PCR) (Fig. 1b). Under natural conditions, whiteflies transmit TYLCV. When plants were infected with TYLCV, MC4 expression was further elevated, whereas other MCs did not exhibit a similar increase (Fig. 1b). Western blot analysis revealed enhanced self-cleavage of MC4 in response to TYLCV infection (Fig. 1c and Supplementary Fig. 1a), indicating that MC4 undergoes auto-activation upon viral infection. These results suggest that MC4 plays an important role in plant defense against insects and viruses.
Fig. 1: MC4 is activated by herbivory and interacts with AtBAG3. The alternative text for this image may have been generated using AI.
a Heat map depicting the expression profile of the Arabidopsis metacaspase genes (MCs) following 3 days of whitefly infestation. Expression levels are shown as log2(TPM + 1), averaged across three biological replicates. Color scale represents average intensity values in log2(TPM + 1). b Expression levels of Arabidopsis metacaspase genes were quantified by RT-qPCR after 3 days of whitefly infestation and TYLCV infection. Values are means ± standard deviation (SD) (n = 6). Data were analyzed by two-way ANOVA followed by Tukey’s test for multiple comparisons. Different lowercase letters indicated statistically significant differences (P < 0.05). The corresponding P-values can be found in the Source Data. The experiment consisted of three biological replicates. c TYLCV infection promotes the activation of MC4. MC4-Flag and MC4C139A-Flag were transiently expressed in Mock- and TYLCV-treated N. benthamiana plants. Protein detections were performed using anti-Flag (α-Flag) and anti-CP (α-CP) antibodies. Coomassie brilliant blue (CBB) stained bands of the large subunit of Rubisco (rbcL) were used as a loading control. Three biological replicates were conducted. d Whitefly infestation promotes the processing of PROPEP1-YFP, and TYLCV infection disturbs this process. Protein detection was performed using an anti-GFP antibody. CBB-stained bands of the rbcL were used as a loading control. Three biological replicates were conducted. e The interaction between MC4 and BAG3 was assessed using a yeast two-hybrid (Y2H) system. The empty vectors pGBT9 and pGAD424 were used as negative controls. f Co-immunoprecipitation (Co-IP) analysis of MC4C139A-Flag and YFP-AtBAG3 in vivo. Total protein was extracted from N. benthamiana leaves transiently expressing 35S: GUS-Flag and 35S: MC4C139A-Flag together with 35S: YFP-AtBAG3. GFP-trap beads were used to precipitate the interaction complex. Anti-GFP (α-GFP) and anti-Flag (α-Flag) antibodies were used for detection. The experiment was repeated independently three times with similar results.
To examine whether whitefly infestation promotes Pep1 maturation, we treated PROPEP1-YFP and PROPEP1-YFP/mc4 Arabidopsis plants with whitefly infestation. Whitefly infestation significantly elevated the expression of PROPEP1 and promoted its cleavage (Fig. 1d and Supplementary Fig. 1b). However, under combined whitefly infestation and viral infection, although MC4 expression level was further induced, its ability to cleave PROPEP1 was markedly reduced. In the PROPEP1-YFP/mc4 plants, PROPEP1 processing was significantly diminished (Fig. 1d and Supplementary Fig. 1b). MC4 promotes PROPEP1 cleavage in response to whitefly infestation alone, but this cleavage is suppressed under combined whitefly and viral stress. These findings suggest that under the combined stress of herbivory and viral infection, MC4 may shift substrate preference to optimize the immune response.
To uncover the potential substrates of MC4, we performed a yeast two-hybrid (Y2H) screen using MC4 as bait against an Arabidopsis cDNA library. Among the candidates, Arabidopsis BAG3 (AtBAG3) was notable given the proposed role of plant BAGs as positive regulators of cell death and immunity24. Phylogenetic analysis of BAG3 homologs across representative plant species revealed that BAG3 belongs to a well-conserved clade in angiosperms (Supplementary Fig. 2). The interaction between MC4 and AtBAG3 was first confirmed using Y2H assays (Fig. 1e). In co-immunoprecipitation (Co-IP) assays, the catalytically inactive mutant MC4C139A-Flag was co-immunoprecipitated by YFP-AtBAG3 (Fig. 1f). Moreover, bimolecular fluorescence complementation (BiFC) assays confirmed the interaction between MC4 and AtBAG3 in planta (Supplementary Fig. 3). Taken together, these results demonstrate that MC4 interacts with AtBAG3 in vitro and in vivo.
BAG3 modulates plant antiviral immunity through N-terminal domain-mediated cell death
To investigate the role of BAG3 in plant antiviral immunity, we generated Atbag3 knockout and YFP-AtBAG3 overexpression Arabidopsis lines (Supplementary Fig. 4a, b). Upon TYLCV infection, AtBAG3 overexpression plants exhibited severe necrosis at 21 days post inoculation (dpi) (Fig. 2a). Trypan blue staining confirmed extensive cell death in AtBAG3 overexpression plants (Fig. 2b). Quantitative PCR (qPCR) further revealed markedly reduced viral titers in AtBAG3 overexpression lines relative to Atbag3 mutants (Fig. 2c). Given that TYLCV primarily infects Solanaceae, with tomato (Solanum lycopersicum) as its principal host, we identified BAG3 homologs in tomato (Fig. 2d) and generated Slbag1/3/3-like (Slbag1/3/3 l) triple mutants (Supplementary Fig. 5a). Under normal conditions, no visible phenotypic differences were observed between Slbag1/3/3 l plants and wild-type (WT) plants (Supplementary Fig. 5b). Upon TYLCV infection, WT plants developed necrotic lesions and chlorosis, whereas Slbag1/3/3 l mutants lacked necrosis but exhibited pronounced leaf curling and stunted growth at 14 dpi (Fig. 2e). Necrosis and chlorosis typically indicate localized defense activation, whereas leaf curling and dwarfing are indicative of systemic infection and developmental disruption25,26. The observed symptoms in Slbag1/3/3 l plants suggest a weakened antiviral response. Consistently, viral titers were markedly elevated in Slbag1/3/3 l plants (Fig. 2f). Together, these findings establish BAG3 as a positive regulator of antiviral immunity in both Arabidopsis and tomato.
Fig. 2: BAG3 modulates plant antiviral immunity through N-terminal domain-mediated cell death.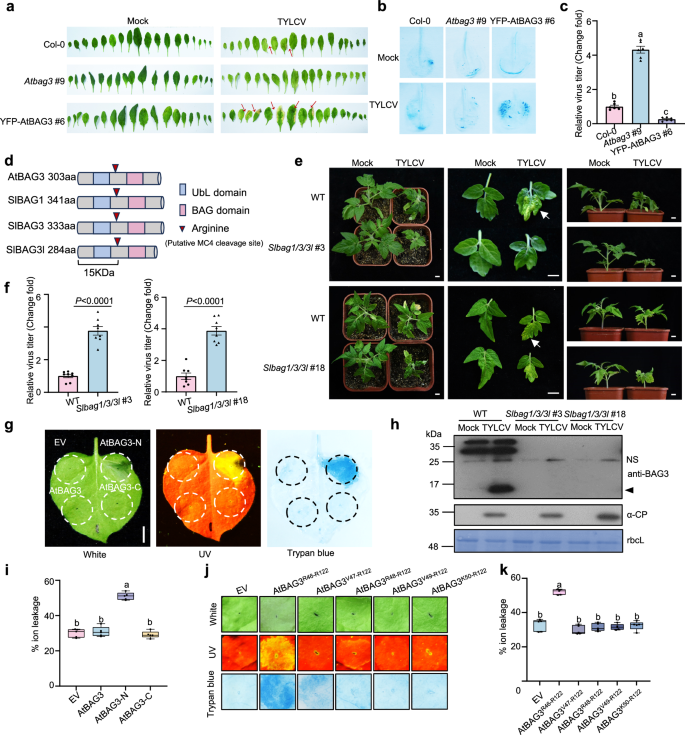 The alternative text for this image may have been generated using AI.
a Phenotypes of leaves from Arabidopsis Col-0, Atbag3 #9, and YFP-AtBAG3 #6 lines mock-treated or TYLCV-infected at 21 days post infiltration (dpi). The leaves are arranged from oldest (left) to youngest (right). The red arrows indicate the necrotic lesions. The experiment was repeated independently three times with similar results. b Trypan blue staining was used to assess cell death in leaves of Col-0, Atbag3 #9, and YFP-AtBAG3 #6 at 21 dpi with TYLCV infection. The experiment was repeated three times with similar results. c Quantification of viral genomic DNA by qPCR in Col-0, Atbag3 #9, and YFP-AtBAG3 #6 at 21 dpi post TYLCV infection. Values are means ± SD of six independent plants (n = 6) from one representative experiment. Data were analyzed by one-way ANOVA followed by Tukey’s test for multiple comparisons. Different lowercase letters indicated statistically significant differences (P < 0.05). The corresponding P-values can be found in the Source Data. d Schematic representation of the structure of the AtBAG3 and SlBAG1/3/3 l proteins. UbL, ubiquitin-like domain; BAG, BAG domain; Arginine, putative MC4 cleavage site. e Symptoms of TYLCV-infected WT and Slbag1/3/3 l #3 and #18 triple mutant tomato plants at 14 dpi. Scale bars = 1 cm. Three biological replicates were performed. The white arrows indicate the necrotic lesions. f Quantification of viral genomic DNA in systemic leaves of plants shown in Fig. 2e by qPCR. Values are means ± SD of eight independent plants (n = 8) from one representative experiment. P-values were calculated by an unpaired two-tailed Student’s t test. The experiment was repeated three times with similar results. g Cell death phenotypes induced by the empty vector (nEYFP), full-length AtBAG3, and domain truncations (AtBAG3-N and AtBAG3-C). The empty vector (nEYFP) was used as a negative control. Leaves were infiltrated in N. benthamiana and stained with trypan blue 2-3 days post-infiltration. Images under white and UV light are shown. Scale bars = 1 cm. The experiment was repeated three times with similar results. h Immunoblot detection of BAG3 and TYLCV coat protein (CP) in samples from Fig. 2e. Anti-BAG3 and anti-CP (α-CP) antibodies were used. Stained bands of rbcL were used as a loading control. The arrow indicates the putative cleaved product of SlBAG1/3/3 l. NS, nonspecific bands. The experiment was repeated three times with similar results. i Quantification of cell death induced by transient expression of AtBAG3, AtBAG3-N, and AtBAG3-C in N. benthamiana. Electrolyte leakage was measured from leaf disks at 2 dpi (n = 5, five biological independent samples from one representative experiment). Data were analyzed by one-way ANOVA followed by Tukey’s test for multiple comparisons. Different lowercase letters indicated statistically significant differences (P < 0.05). The corresponding P-values can be found in the Source Data. In box and whiskers, the center line indicates the median, the bounds of the box show the 25th and 75th percentiles, the whiskers indicate the minimum to maximum values. The experiments were performed three times with similar results. j Cell death phenotypes of AtBAG3-N truncations in N. benthamiana leaves. The empty vector (nEYFP) was used as a negative control. Infiltrated leaves were stained with trypan blue, and representative photographs were taken at 2-3 dpi. Images under white and UV light are shown. The experiments were performed three times with similar results. k Quantification of cell death induced by transient expression of AtBAG3-N truncations in N. benthamiana. Electrolyte leakage of leaf disks from N. benthamiana was measured at 2 dpi (n = 5, five biological independent samples from one representative experiment). Data were analyzed by one-way ANOVA followed by Tukey’s test for multiple comparisons. Different lowercase letters indicated statistically significant differences (P < 0.05). The corresponding P-values can be found in the Source Data. In box and whiskers, the center line indicates the median, the bounds of the box show the 25th and 75th percentiles, the whiskers indicate the minimum to maximum values. The experiments were performed three times with similar results.
The observed differences in necrosis between WT and bag mutant plants upon TYLCV infection prompted us to examine whether BAG3 directly mediates cell death. To verify the potential role of BAG3 in inducing cell death, we generated constructs encoding the full-length AtBAG3 protein. No cell death was observed in Nicotiana benthamiana (N. benthamiana) leaves transiently expressing AtBAG3 (Fig. 2g). Western blot analysis of SlBAG1/3/3 l expression in TYLCV-infected tomato plants (Fig. 2e) revealed the appearance of a distinct band at approximately 15 kDa beneath the major SlBAG1/3/3 l bands in TYLCV-infected samples (Fig. 2d, h). This band was consistently absent in mock-treated controls and Slbag1/3/3 l mutants. These findings suggest that SlBAG1, SlBAG3, and SlBAG3l may undergo proteolytic cleavage in response to viral infection, generating a smaller cleavage product.
Since BAG3 consists of an N-terminal ubiquitin-like (UbL) domain and a C-terminal BAG domain16, and both BAG3-N and BAG3-C fragments are approximately 15 kDa, we hypothesized that one of these fragments might induce cell death. To test this, we generated truncations encoding N-terminal (AtBAG3-N) and C-terminal (AtBAG3-C) domains. Notably, AtBAG3-N (1-122 amino acids, aa) was sufficient to induce cell death (Fig. 2g and Supplementary Fig. 6a). The increased ion conductivity indicated that AtBAG3-N expression exacerbated membrane damage (Fig. 2i). Given that the protein sequences of AtBAG3-N, SlBAG1-N, SlBAG3-N and SlBAG3l-N exhibit an 83.44% identity in their alignments (Supplementary Fig. 7a), we further explored the functional roles of their N-terminal domains by generating truncated versions of SlBAG1, SlBAG3 and SlBAG3l proteins. The results showed that the N-terminal domains of SlBAG1, SlBAG3 and SlBAG3l were able to induce cell death (Supplementary Fig. 7b–d), indicating that this domain acts as the key executor of BAG3-mediated cell death.
To identify the minimal functional domain of BAG3 required for cell death induction, we generated a series of truncation constructs and transiently expressed them in N. benthamiana leaves. C-terminal truncation analysis demonstrated that AtBAG3 retains its cell death-inducing activity until residue arginine (Arg, R) 122, beyond which the activity is completely abolished (Supplementary Fig. 8a, c). To further delineate the critical region, we systematically performed N-terminal truncations with single-residue resolution (Supplementary Fig. 8b, c), ultimately identifying the segment spanning R46 to R122 as the minimal functional domain essential for cell death induction (Fig. 2j, k and Supplementary Fig. 6b). These findings highlight BAG3-N as the core signaling domain responsible for BAG3-induced cell death, with R46-R122 identified as the minimal functional region essential for triggering cell death.
MC4 cleaves BAG3 at R122
To investigate how BAG3 activity is regulated under resting conditions, we hypothesized that it adopts an auto-inhibited conformation via intra-molecular interactions between its N- and C-terminal domains. Co-expression of AtBAG3-N with AtBAG3-C in N. benthamiana revealed that AtBAG3-C suppressed AtBAG3-N-induced cell death (Fig. 3a), supporting an inhibitory role for the C-terminus. Notably, co-expression of AtBAG3-N with an empty vector still triggered cell death (Fig. 3a), indicating that endogenous N. benthamiana NbBAG3-C is insufficient to inhibit the activity of exogenous AtBAG3-N. Structural predictions using AlphaFold 3 indicated a direct interaction between AtBAG3-N and AtBAG3-C (Fig. 3b). Co-IP assays confirmed the inter-domain interaction of BAG3 (Fig. 3c). Moreover, BiFC assays further confirmed the interaction between BAG3-N and BAG3-C in planta (Supplementary Fig. 9). Together, these results demonstrate that AtBAG3 adopts an auto-inhibited conformation mediated by direct interaction between its N- and C-terminal regions under resting conditions.
Fig. 3: MC4 cleaves AtBAG3 at R122.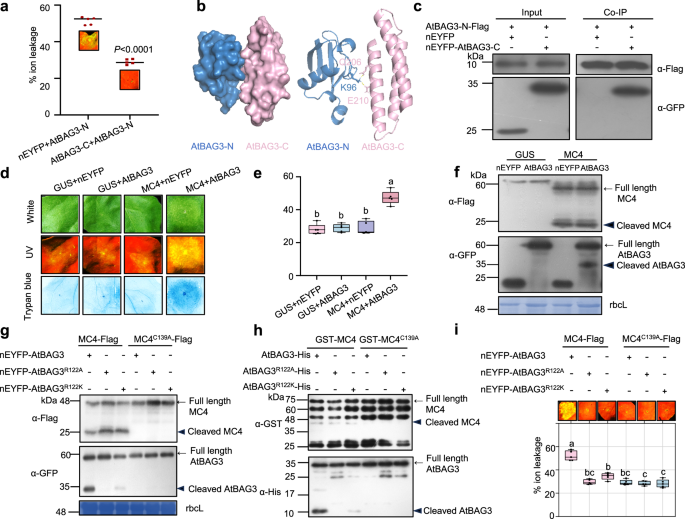 The alternative text for this image may have been generated using AI.
a Cell death phenotypes of AtBAG3-N co-infiltrated with AtBAG3-C in N. benthamiana leaves and quantification of the cell death. nEYFP was used as a negative control. Representative images under UV light were taken at 2 dpi. Electrolyte leakage of leaf disks from N. benthamiana was measured at 2 dpi (n = 5). P-values were calculated by an unpaired two-tailed Student’s t test. The experiment was repeated independently three times with similar results. b The interaction model between AtBAG3-N (blue) and AtBAG3-C (pink) was predicted using AlphaFold 3. The stick model represents the potential interaction sites between AtBAG3-N and AtBAG3-C; this region is predicted with a high confidence score. c Co-IP analysis of AtBAG3-N-Flag and nEYFP-AtBAG3-C in vivo. Total proteins were extracted from N. benthamiana leaves transiently expressing 35S: nEYFP and 35S: nEYFP-AtBAG3-C together with 35S: AtBAG3-N-Flag. Flag-trap beads were used to precipitate the interaction complex, and anti-GFP (α-GFP) and anti-Flag (α-Flag) antibodies were used for detection. The experiments were performed three times with similar results. d Cell death phenotypes of MC4 co-infiltrated with AtBAG3 in N. benthamiana leaves. GUS-Flag and empty vector (nEYFP) were used as negative controls. Infiltrated leaves were stained with trypan blue, and representative photographs were taken at 2-3 dpi. Images under white and UV light are shown. The experiment was repeated independently three times with similar results. e Quantification of cell death induction of MC4 and AtBAG3 in N. benthamiana. Electrolyte leakage of leaf disks from N. benthamiana was measured at 2 dpi (n = 5). Data were analyzed by one-way ANOVA followed by Tukey’s test for multiple comparisons. Different lowercase letters indicated statistically significant differences (P < 0.05). The corresponding P-values can be found in the Source Data. In box and whiskers, the center line indicates the median, the bounds of the box show the 25th and 75th percentiles, the whiskers indicate the minimum to maximum values. The experiment was repeated independently three times with similar results. f Protein detection of Fig. 3d was performed using anti-Flag (α-Flag) and anti-GFP (α-GFP) antibodies. Stained bands of rbcL were used as a loading control. The experiment was repeated independently three times with similar results. g Only MC4, but not the catalytically inactive MC4C139A variant, can cleave AtBAG3 in N. benthamiana leaves. Replacement of AtBAG3 R122 with A or K impaired AtBAG3 cleavage in vivo. Stained bands of rbcL were used as a loading control. The experiment was repeated independently three times with similar results. h Only MC4 but not catalytically inactive MC4C139A variant can cleave AtBAG3 in vitro. MC4 cleaves AtBAG3 after residue R122. The experiment was repeated independently three times with similar results. i Top: cell death phenotypes of MC4 and the catalytically inactive MC4C139A variant co-infiltrated respectively with AtBAG3, AtBAG3R122A, and AtBAG3R122K in N. benthamiana leaves. Representative photographs were taken at 2-3 dpi. Images under UV light are shown. Bottom: quantification of cell death induction by MC4 and catalytically inactive MC4C139A variant co-infiltrated respectively with AtBAG3, AtBAG3R122A and AtBAG3R122K in N. benthamiana. Electrolyte leakage of leaf disks from N. benthamiana was measured at 2 dpi (n = 5). Data were analyzed by one-way ANOVA followed by Tukey’s test for multiple comparisons. Different lowercase letters indicated statistically significant differences (P < 0.05). The corresponding P-values can be found in the Source Data. In box and whiskers, the center line indicates the median, the bounds of the box show the 25th and 75th percentiles, the whiskers indicate the minimum to maximum values. The experiment was repeated independently three times with similar results.
Type II metacaspases, such as MC4, are known to cleave substrates after arginine (R) or lysine (K) residues27. The previously identified minimal cell death-inducing region of AtBAG3 spans residues R46-R122 (Fig. 2j, k). Considering the interaction between MC4 and AtBAG3, we hypothesized that MC4-mediated cleavage may release the active N-terminal domain of AtBAG3. Indeed, co-expression of AtBAG3 with MC4 induced cell death (Fig. 3d, e). Western blot analysis revealed that MC4 undergoes self-cleavage and cleaves AtBAG3, producing a product consistent with the size of AtBAG3-N (Fig. 3f).
To exclude potential interference from endogenous components, we identified N. benthamiana BAG3 homologs NbBAG1, NbBAG3, and NbBAG3-like (NbBAG3l) by sequence alignment and silenced them simultaneously using virus-induced gene silencing (VIGS) (Supplementary Fig. 10a). Silencing of NbBAG1/3/3l had no effect on AtBAG3/MC4-induced cell death (Supplementary Fig. 10b). In addition, co-expression of AtBAG3 or MC4 with empty vector did not induce cell death or AtBAG3 cleavage (Fig. 3d–f), confirming that endogenous NbBAG1/3/3 l do not interfere with AtBAG3/MC4-induced cell death under these conditions. In contrast, the catalytically inactive mutant MC4C139A failed to cleave AtBAG3 (Fig. 3g, h). Moreover, co-expression of AtBAG3 with MC4C139A failed to induce cell death (Fig. 3i), underscoring the requirement of MC4 enzymatic activity for AtBAG3 cleavage and subsequent cell death.
To pinpoint the cleavage site, we co-expressed MC4 with AtBAG3R122A (arginine to alanine) or the homotypic AtBAG3R122K (arginine to lysine) mutant individually. Neither AtBAG3R122A nor AtBAG3R122K triggered cell death when co-expressed with MC4 (Fig. 3i). The Mutated AtBAG3R122A cleavage site was not cleaved by MC4 in vivo. The homotypic AtBAG3R122K mutation was cleaved, albeit less efficiently (Fig. 3g). To further assess the direct dependence of AtBAG3 maturation on MC4, in vitro cleavage assays were performed using recombinant GST-MC4 and AtBAG3-His. Consistent with the in vivo results, mutated AtBAG3R122A-His cleavage sites were not cleaved by MC4 in vitro. Although the homotypic AtBAG3R122K mutation was cleaved, the efficiency was comparatively lower (Fig. 3h). Collectively, these results demonstrate that the precise cleavage at R122 by MC4 is essential for the release of the BAG3-N domain, which in turn induces cell death.
Oligomerization and plasma membrane localization are essential for BAG3-N-induced cell death
Self-interaction is a key mechanism underlying the activation of cell death regulators28,29,30,31,32. To determine whether BAG3-N-induced cell death requires self-interaction, we utilized AlphaFold 3 to predict the self-interaction of AtBAG3-N and identified several putative interaction sites (Fig. 4a). To validate these predictions functionally, we performed site-directed mutagenesis, substituting key residues with alanine (A) individually. Among these, substitution of lysine at position 50 with A (K50A) completely abolished the cell death phenotype, suggesting that K50 is essential for AtBAG3-N-induced cell death (Fig. 4b). Western blot analysis confirmed the correct expression of all proteins (Fig. 4c). Co-IP assays confirmed the self-interaction of AtBAG3-N (Fig. 4d), but revealed dramatically impaired self-interaction for the AtBAG3K50A-N mutant (Supplementary Fig. 11a). Consistently, BiFC assays demonstrated the self-interaction of AtBAG3-N, which was abolished in the AtBAG3K50A mutant (Supplementary Fig. 11b). Given that oligomerization underlies the activation of resistosome complexes such as ZAR1, we tested whether BAG3-N also forms oligomers33. Blue native PAGE (BN-PAGE) analysis showed that AtBAG3-N migrates as high molecular weight bands, potentially indicative of oligomeric assemblies, whereas the AtBAG3K50A mutant exhibited a marked reduction (Fig. 4e). These findings strongly indicate self-association as a prerequisite for BAG3-N oligomerization and subsequent cell death activity.
Fig. 4: Oligomerization and PM localization are essential for BAG3-N-induced cell death.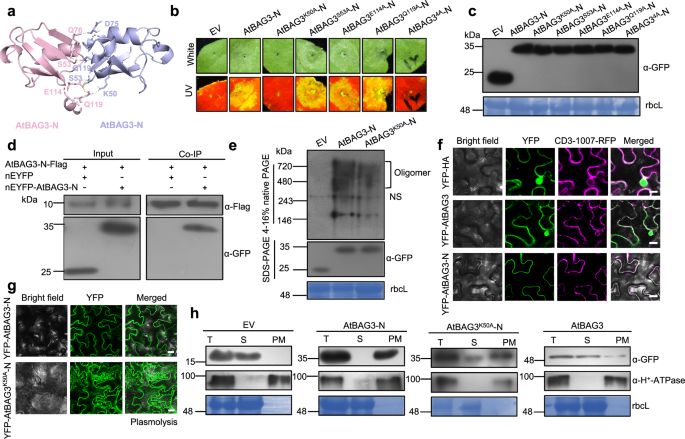 The alternative text for this image may have been generated using AI.
a The self-interaction model of AtBAG3-N were predicted using AlphaFold 3. AtBAG3-N monomers are represented in pink and purple. The stick model represents the potential self-interaction sites; this region is predicted with a high confidence score. b Cell death phenotypes of AtBAG3-N point mutants transiently expressed in N. benthamiana leaves. Representative photographs were taken at 2-3 dpi. Images under white and UV light are shown. The experiment was repeated independently three times with similar results. c Protein detection of Fig. 4b was performed using an anti-GFP (α-GFP) antibody. Stained bands of rbcL were used as a loading control. d Co-IP analysis of AtBAG3-N-Flag and nEYFP-AtBAG3-N in vivo. Total protein was extracted from N. benthamiana leaves at 2 dpi after transient co-expression of 35S: nEYFP-AtBAG3-N and 35S: AtBAG3-N-Flag. Flag-trap beads were used to precipitate the interaction complex, and anti-GFP (α-GFP) and anti-Flag (α-Flag) antibodies were used for detection. e AtBAG3-N oligomerization state, as detected by BN-PAGE. Square brackets point to oligomers. NS, nonspecific bands (upper image). The protein expression level and loading control were detected by SDS-PAGE and rbcL, respectively (bottom image). f Subcellular localization of YFP-HA, YFP-AtBAG3 and YFP-AtBAG3-N was observed in N. benthamiana at 2 dpi by confocal microscopy. Scale bars = 25 μm. The experiment was repeated three times with similar results. g YFP fluorescence was observed after cell plasmolysis in N. benthamiana leaves. Leaves were treated with 5 % NaCl for 5–10 mins to trigger cell plasmolysis. The cell wall is marked by dotted lines. Scale bars =25 μm. The experiment was repeated three times with similar results. h Total protein (T) was separated into soluble (S) and plasma membrane (PM) fractions. H+-ATPase was used as a plasma membrane marker. Antibodies against GFP and H+-ATPase were used. The experiment was repeated independently three times with similar results.
Proper subcellular localization is crucial for the function of proteins that induce cell death32,34,35. To determine the localization of full-length AtBAG3 and AtBAG3-N, we performed confocal microscopy, which revealed that YFP-AtBAG3-N fluorescence completely overlapped with the plasma membrane (PM) marker CD3-1007-RFP36 (Fig. 4f). In addition, plasmolysis analysis further supported the possible plasma membrane localization of YFP-AtBAG3-N (Fig. 4g). To confirm this, we performed cellular compartment fractionation assays in N. benthamiana leaves expressing YFP-HA, YFP-AtBAG3, YFP-AtBAG3-N and YFP-AtBAG3K50A-N. While full-length AtBAG3 was predominantly detected in soluble fractions, AtBAG3-N was exclusively detected in the plasma membrane fraction, further supporting the plasma membrane localization of AtBAG3-N (Fig. 4h). Moreover, the AtBAG3K50A-N mutation not only impaired oligomerization but also disrupted the plasma membrane localization of AtBAG3-N (Fig. 4e, g, h). Although AtBAG3-N lacks canonical lipid modifications or transmembrane domains, it is localized at the plasma membrane (Fig. 4f–h), suggesting that its recruitment may occur through protein-protein interactions. These findings suggest that both oligomerization and PM localization are essential for BAG3-N-induced cell death.
BAG3-N induces conserved cell death across angiosperms
BAG proteins are a conserved family across eukaryotes14. To assess whether BAG3-N-induced cell death is evolutionarily conserved, we performed sequence alignments to identify homologs of AtBAG3-N across a diverse range of plant species. These included monocots such as Oryza sativa (Os-) and Zea mays (Zm-); dicots such as Solanum lycopersicum (Sl-), Davidia involucrata (Di-), Weddellina squamulosa (Ws-) and Terniopsis brevis (Tb-); gymnosperms such as Picea sitchensis (Ps-); pteridophytes such as Selaginella moellendorffii (Sm-); and bryophytes including the liverwort Marchantia polymorpha (Mp-) and the moss Physcomitrium patens (Pp-). Phylogenetic analysis was conducted for these species (Fig. 5a). To further investigate whether BAG3-N-induced cell death is conserved in monocots, we expressed the N-terminal domains of OsBAG3 and ZmBAG3 in N. benthamiana leaf cells. Both OsBAG3-N and ZmBAG3-N induced cell death (Supplementary Fig 12a–c). In contrast, the N-terminal domains of MpBAG3 and PpBAG3 (MpBAG3-N and PpBAG3-N), derived from bryophytes, failed to trigger cell death (Supplementary Fig. 12d–f). Sequence alignment revealed that a conserved lysine (K) at position 50 in angiosperms is mutated to threonine (T) / serine (S) in gymnosperms and lower plant lineages (Fig. 5a). Mutant variants BAG3K50T-N and BAG3K50S-N failed to induce cell death (Supplementary Fig. 13a, b), indicating that K50 is critical for the function of BAG3-N. Taken together, our findings suggest that the BAG3-N-induced cell death response is conserved across angiosperms and may contribute to broad-spectrum antiviral defense.
Fig. 5: BAG3-N induces conserved cell death across angiosperms.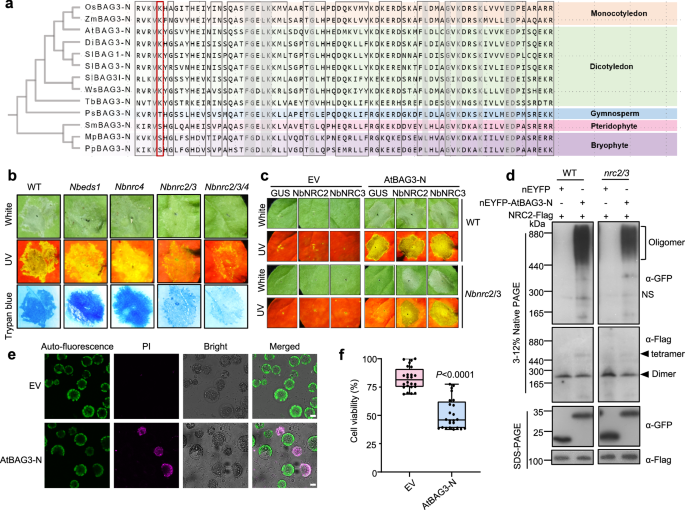 The alternative text for this image may have been generated using AI.
a The maximum likelihood phylogenetic tree was generated in MEGA using BAG3-N domain sequences of 13 BAG3 homologs identified from Oryza sativa (Os-), Zea mays (Zm-), Arabidopsis thaliana (At-), Davidia involucrata (Di-), Solanum lycopersicum (Sl-), Weddellina squamulosa (Ws-), Terniopsis brevis (Tb-), Picea sitchensis (Ps-), Selaginella moellendorffii (Sm-), Marchantia polymorpha (Mp-) and Physcomitrium patens (Pp-). The red frame highlights the amino acid at position 50 of BAG3 across different species. b Cell death phenotypes induced by the empty vector (nEYFP) and AtBAG3-N infiltrated in the leaves of WT, Nbeds1, Nbnrc2/3, Nbnrc4 and Nbnrc2/3/4 mutants. Representative photographs were taken at 2-3 dpi. Images under white and UV light are shown. The experiment was repeated independently three times with similar results. c GUS, NbNRC2 or NbNRC3 was co-expressed with AtBAG3-N in WT and Nbnrc2/3 mutant lines. GUS and empty vector (nEYFP) were used as a negative control. Representative photographs were taken at 2-3 dpi. Images under white and UV light are shown. The experiment was repeated independently three times with similar results. d BN-PAGE assay testing the oligomeric status of AtBAG3-N co-expressed with NbNRC2 in the leaves of WT and Nbnrc2/3 (upper image). Square brackets point to oligomers. NS, nonspecific bands (upper image). The protein expression level and loading control were detected by SDS-PAGE and rbcL, respectively (bottom image). The experiment was repeated independently three times with similar results. e Imaging of AtBAG3-N-induced cell death in Arabidopsis protoplasts. Protoplasts expressing AtBAG3-N were stained with PI before imaging. Bright-field image and autofluorescence were collected to show the morphology of the protoplasts. PI staining images were collected to show the dead cells. Scale bars = 25 μm. The experiment was repeated independently three times with similar results. f Quantification of cell death induced by AtBAG3-N expression in Arabidopsis protoplasts. The number of viable cells in culture based on the quantitation of ATP, which indicates the presence of metabolically active cells (n = 24). P-values were calculated by an unpaired two-tailed Student’s t test. In box and whiskers, the center line indicates the median, the bounds of the box show the 25th and 75th percentiles, the whiskers indicate the minimum to maximum values. The experiment was repeated independently three times with similar results.
Based on the observation that BAG3-N-induced cell death is a conserved response, we sought to investigate whether this response occurs independently through BAG3-N alone or requires the assistance of other proteins. Specifically, we aimed to determine whether the induction of cell death by BAG3-N in plants relies on EDS1, a family of proteins essential for the function of all tested Toll/interleukin-1 receptor NLRs (TNLs)6, or on helper NLRs, such as NRC2/3/4, which are known to play pivotal roles in the immune responses of various coiled-coil NLRs (CNLs) in solanaceous plants37. To verify whether the cell death triggered by BAG3-N requires these immune signaling components, we expressed AtBAG3-N in leaves of Nbeds1, Nbnrc2/3, Nbnrc4 and Nbnrc2/3/4 mutants and observed the cell death phenotype. AtBAG3-N was able to induce cell death in Nbeds1 and Nbnrc4 mutants, whereas it failed to induce cell death in Nbnrc2/3 and Nbnrc2/3/4 mutants (Fig. 5b). Western blot analysis revealed markedly reduced AtBAG3-N protein levels in Nbnrc2/3 and nrc2/3/4 plants (Supplementary Fig. 14a), suggesting that the lack of cell death may be due to insufficient BAG3-N expression. Co-expression of NbNRC2 or NbNRC3 with AtBAG3-N in Nbnrc2/3 mutants rescued the cell death phenotype (Fig. 5c and Supplementary Fig. 14b). Notably, the resting state of NRC2 forms homodimers or tetramers38, while its activated form adopts a hexameric structure31. BN-PAGE revealed that co-expression of AtBAG3-N and NbNRC2 led to the accumulation of dimeric and tetrameric NRC2 complexes (Fig. 5d), suggesting that AtBAG3-N functions via inactive NRC2 oligomers. Given that AtBAG3-N expression was reduced in Nbnrc2/3 and Nbnrc2/3/4 mutants (Supplementary Fig. 14a), we cannot rule out the possibility that loss of cell death is partially due to protein instability.
Notably, there is currently no evidence indicating the presence of NRC2/3 in Arabidopsis. To better understand BAG3-N-induced cell death, we stained Arabidopsis protoplasts with propidium iodide (PI) to assess plasma membrane integrity32. At 12 h post-transfection, protoplasts expressing AtBAG3-N exhibited PI uptake, suggesting a loss of plasma membrane integrity (Fig. 5e). We then evaluated AtBAG3-N-induced cell death in protoplasts using the Cell Titer-Glo Luminescent Cell Viability Assay, which quantifies cellular ATP levels33. AtBAG3-N expression led to a significant reduction in cell viability (Fig. 5f). These results indicate that BAG3-N can induce cell death in Arabidopsis protoplasts. Together, these results suggest that BAG3-N-induced cell death is conserved across angiosperms but engages divergent downstream signaling modules depending on species context.
Viral Rep protein suppresses BAG3-N-induced cell death
Plant viruses have evolved various strategies to subvert host defenses and facilitate infection3,39,40. To investigate whether TYLCV-encoded proteins suppress BAG3-N-induced cell death, we co-expressed AtBAG3-N with each of the six canonical TYLCV proteins in N. benthamiana and monitored the cell death phenotypes. Among the viral proteins tested, only Rep markedly suppressed AtBAG3-N-induced cell death (Fig. 6a). Electrolyte leakage assays showed reduced membrane damage upon co-expression of Rep with AtBAG3-N (Fig. 6b). Western blot analysis confirmed the correct expression of all proteins (Supplementary Fig. 15).
Fig. 6: Viral Rep protein suppresses BAG3-N-induced cell death.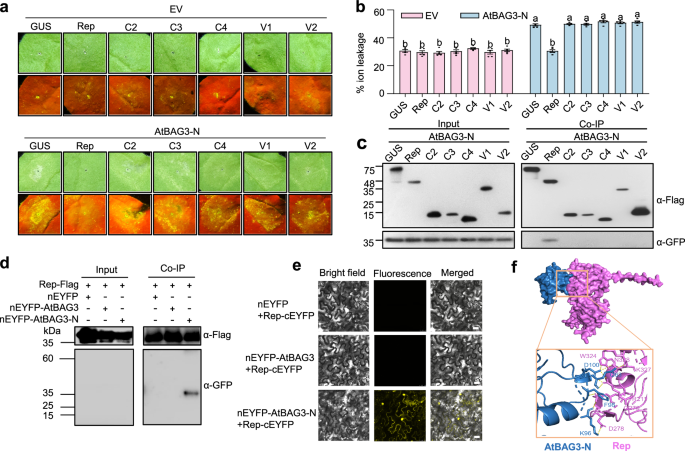 The alternative text for this image may have been generated using AI.
a Cell death phenotypes of AtBAG3-N co-infiltrated with the six canonical TYLCV-encoded viral proteins (Rep, C2, C3, C4, V1 and V2), respectively, in N. benthamiana leaf cells. GUS and empty vector (nEYFP) were used as a negative control. Representative photographs were taken at 2 dpi. Images under white and UV light are shown. The experiment was repeated independently three times with similar results. b Quantification of cell death induction of AtBAG3-N co-expressed with TYLCV-encoded viral proteins in N. benthamiana. Electrolyte leakage of leaf disks from N. benthamiana was measured at 2 dpi. Values are means ± SD of five biological independent samples (n = 5) from one representative experiment. Data were analyzed by one-way ANOVA followed by Tukey’s test for multiple comparisons. Different lowercase letters indicated statistically significant differences (P < 0.05). The corresponding P-values can be found in the Source Data. The experiment was repeated independently three times with similar results. c Co-IP analysis of nEYFP-AtBAG3-N and TYLCV-encoded viral proteins in vivo. Total protein was extracted from N. benthamiana leaves transiently expressing 35S: nEYFP or 35S: nEYFP-AtBAG3-N together with TYLCV-encoded viral proteins. Flag-trap beads were used to precipitate the interaction complex, and anti-GFP (α-GFP) and anti-Flag (α-Flag) antibodies were used for detection. The experiment was repeated independently three times with similar results. d Co-IP analysis of Rep-Flag with nEYFP, nEYFP-AtBAG3, and nEYFP-AtBAG3-N. Total protein was extracted from N. benthamiana leaves transiently expressing 35S: nEYFP, 35S: nEYFP-AtBAG3 and 35S: nEYFP-AtBAG3-N together with 35S: Rep-Flag. Flag-trap beads were used to precipitate the interaction complex, anti-GFP(α-GFP) and anti-Flag (α-Flag) antibodies were used for detection. The experiment was repeated independently three times with similar results. e BiFC assay verifies the interactions between Rep-cEYFP and nEYFP-AtBAG3, and between Rep-cEYFP and nEYFP-AtBAG3-N in planta. Scale bars = 25 μm. The experiment was repeated independently three times with similar results. f The interaction model between AtBAG3-N (blue) and Rep (purple) was predicted using AlphaFold 3. The stick model represents the potential interaction sites between AtBAG3-N and TYLCV Rep; this region is predicted with a high confidence score.
To elucidate the mechanism by which Rep suppresses BAG3-N-induced cell death, we examined whether Rep interacts with AtBAG3-N or the full-length AtBAG3. Co-IP assays revealed that, among all TYLCV-encoded proteins, only Rep was specifically associated with AtBAG3-N (Fig. 6c). Notably, Rep did not associate with full-length AtBAG3, suggesting that it selectively targets the N-terminal domain of AtBAG3 (Fig. 6d). In addition, BiFC assays further confirmed the Rep and AtBAG3-N interaction in planta (Fig. 6e). Structure predictions using AlphaFold 3 suggested that Rep mimics the interaction pattern of AtBAG3-C with AtBAG3-N (Fig. 6f). Collectively, these results indicate that Rep suppresses BAG3-N-induced cell death by directly associating with BAG3-N.
Notably, while the Rep protein of TYLCV is sufficient to suppress BAG3-N-induced cell death, the ability to inhibit this response varies among Sri Lankan cassava mosaic virus (SLCMV) strains. Specifically, the recently emerged SLCMVHN7 strain effectively suppresses AtBAG3-N-induced cell death, whereas the SLCMVCol strain failed to do so (Supplementary Fig. 16a, b), suggesting strain-specific differences in immune evasion capacity.