


Xponential Fitness (XPOF) closed out FY 2025 with Q4 revenue of US$83.0 million and a basic EPS loss of US$1.17, alongside a trailing twelve month revenue base of US$314.9 million and a TTM basic EPS loss of US$1.47. Over the last six reported quarters, the company has seen quarterly revenue range from US$76.2 million to US$83.2 million while basic EPS losses have moved between US$0.01 and US$1.36. This gives investors a clearer view of how sales and per share results have interacted through the recent reporting cycle. With the stock at US$6.54, the latest numbers keep the focus on how effectively Xponential can convert its revenue footprint into more efficient margins.
See our full analysis for Xponential Fitness.
With the headline figures on the table, the next step is to set these results against the most widely held narratives around Xponential to see which stories the numbers support and which they call into question.
See what the community is saying about Xponential Fitness
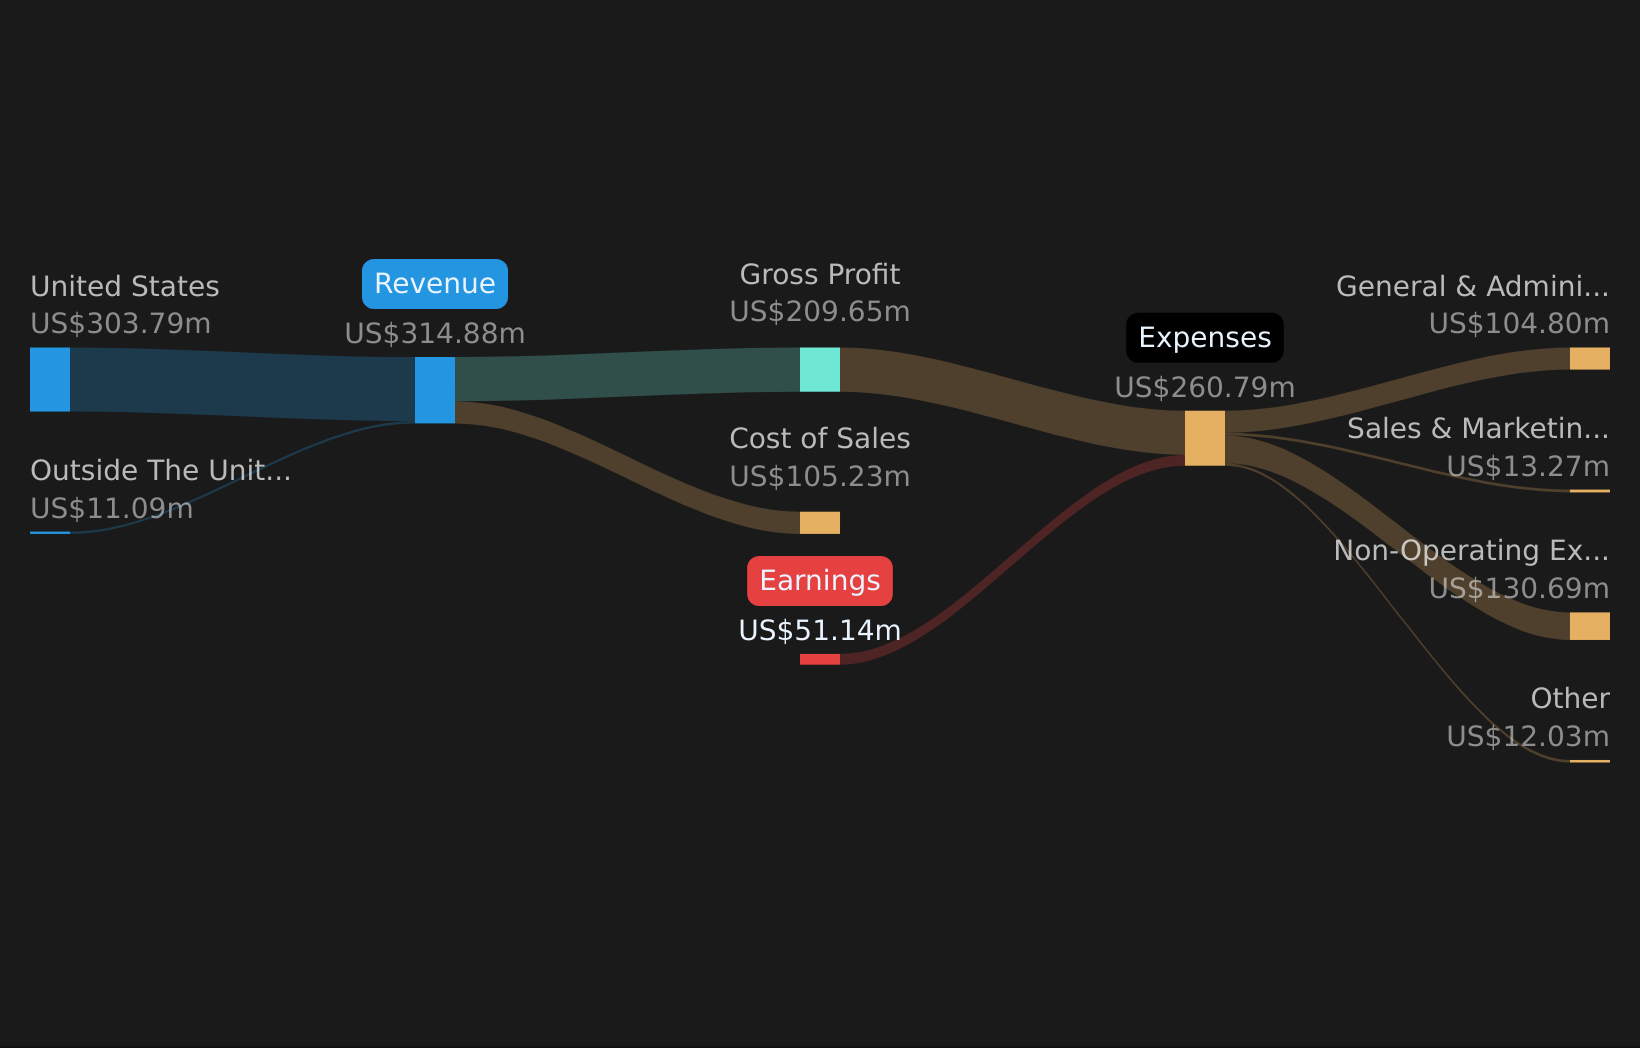 NYSE:XPOF Revenue & Expenses Breakdown as at May 2026 TTM losses of US$51.1 million keep profitability in focus On a trailing twelve month basis to Q4 FY 2025, Xponential reported total revenue of US$314.9 million and a net loss of US$51.1 million, with TTM basic EPS at a loss of US$1.47. Bulls point to forecasts that earnings could turn positive even as revenue is expected to decline about 3.6% per year. However, the current TTM loss and EPS of US$1.47 loss highlight how far results still are from the bullish assumptions that margins rise from roughly a 16% loss today to double digit profit within a few years.
Consensus narrative expects earnings to reach US$31.7 million with a 10.5% margin in about three years, which contrasts sharply with the current TTM loss of US$51.1 million. Bullish projections that earnings could reach US$38.3 million by around 2029 are even further from the present position where net income remains negative on both quarterly and TTM views. Price to sales at 0.9x vs peers at 8.3x The stock trades on a P/S of 0.9x compared with peers at 8.3x and the US Hospitality industry at 1.7x, while the share price of US$6.54 sits about 45.9% below the DCF fair value estimate of US$12.09. Supporters of the bullish view argue that this discount is tied to a temporary earnings hole that could close quickly. The combination of a TTM net loss of US$51.1 million and negative shareholders’ equity means the low P/S and gap to the US$12.09 DCF fair value leave a lot riding on the bullish margin expansion story.
Consensus forecasts for annual revenue decline of roughly 1.5% to 3.6% alongside a move to around a 10% margin imply a very different earnings mix versus today, which may be one reason the stock trades below the 7.69 analyst target. The current valuation multiple looks cheap relative to peers, yet the flagged balance sheet risk from negative equity and a history of widening losses over five years helps explain why the market has not simply followed the DCF or analyst targets. On a set of numbers like this, bulls and bears are looking at the same discount to DCF and analyst targets but draw very different conclusions about how quickly earnings can catch up to the price gap, and how much risk sits in the balance sheet and franchise pipeline before that happens. 🐂 Xponential Fitness Bull Case Negative shareholders’ equity and higher volatility weigh on the bear case Negative shareholders’ equity and higher share price volatility versus the US market have been flagged alongside a TTM net loss of US$51.1 million and losses that have grown at about 7.8% annually over five years. Skeptics focus on these balance sheet and franchise risks. The bearish narrative that growth and leverage leave little room for error has to be weighed against forecasts that earnings could grow at very large rates from today’s loss, which would change these risk metrics if the improvement materializes.
Bears highlight high leverage and delayed or terminated franchise licenses, while current revenue of roughly US$315 million and an estimated move to US$300 million to US$340 million over the next few years would still support a very different earnings profile if margins move from a loss to above 10% as projected. Even in the more cautious narrative, analysts’ models still point to positive earnings in the tens of millions of US dollars within a few years, which sits in tension with a current share price of US$6.54 that already reflects concerns about debt, closures and volatility. For a business carrying negative equity and recent share price swings, checking the detailed bear case can help you see exactly which risks are quantified and how they compare with the current valuation and earnings path. 🐻 Xponential Fitness Bear Case Next Steps
To see how these results tie into long-term growth, risks, and valuation, check out the full range of community narratives for Xponential Fitness on Simply Wall St. Add the company to your watchlist or portfolio so you’ll be alerted when the story evolves.
With both risks and rewards in play throughout this story, now is a good time to look through the data yourself and stress test your view against the 2 key rewards and 2 important warning signs
See What Else Is Out There
With a TTM net loss of US$51.1 million, negative shareholders’ equity and balance sheet pressure, Xponential’s current profile leans heavily toward higher risk.
If this kind of financial strain makes you uneasy, it is worth checking companies with steadier foundations using the solid balance sheet and fundamentals stocks screener (44 results) for ideas that better match a lower risk profile.
This article by Simply Wall St is general in nature. We provide commentary based on historical data
and analyst forecasts only using an unbiased methodology and our articles are not intended to be financial advice. It does not constitute a recommendation to buy or sell any stock, and does not take account of your objectives, or your
financial situation. We aim to bring you long-term focused analysis driven by fundamental data.
Note that our analysis may not factor in the latest price-sensitive company announcements or qualitative material.
Simply Wall St has no position in any stocks mentioned.
New: AI Stock Screener & Alerts
Our new AI Stock Screener scans the market every day to uncover opportunities.
• Dividend Powerhouses (3%+ Yield)
• Undervalued Small Caps with Insider Buying
• High growth Tech and AI Companies
Or build your own from over 50 metrics.
Have feedback on this article? Concerned about the content? Get in touch with us directly. Alternatively, email editorial-team@simplywallst.com