


Sugar-sweetened beverages and health
Sugar-sweetened beverages (SSBs) or sugary drinks are leading sources of added sugars in the American diet. Frequently drinking SSBs is associated with weight gain, obesity, type 2 diabetes, heart disease, non-alcoholic liver disease, tooth decay and cavities, and gout, a type of arthritis.123
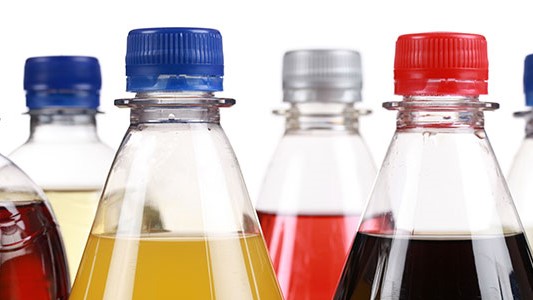
What are sugar-sweetened beverages?
SSBs are any drinks that are sweetened with various forms of added sugars. Examples of added sugars include sweeteners, such as table sugar, sugars from syrups and honey, and sugars from concentrated fruit or vegetable juices.4
Examples of SSBs include, but are not limited to, regular soda, fruit drinks, sports drinks, energy drinks, sweetened waters, and coffee and tea beverages with added sugars.5
Replacing added sugars with low- and no-calorie sweeteners may reduce calorie intake in the short-term and aid in weight management. However, questions remain about their effectiveness as a long-term weight management strategy.5
SSB consumption varies by age, sex, race and ethnicity, geography, and socioeconomic status.
Age
Adults
In 2011–2014, 5 in 10 adults (49%) drank a sugar-sweetened beverage on a given day. On average, U.S. adults consumed 145 calories from SSBs on a given day.6
Children
In 2011–2014, 6 in 10 youth (63%) drank a sugar-sweetened beverage on a given day. On average, U.S. youth consumed 413 calories from SSBs on a given day.7
Among U.S. children aged 1 to 5 years, 57.1% reported consuming at least one sugar-sweetened beverages in the past 7 days.8
Percentage of children aged 1-5 years who drank at least one SSB in the preceding week, by state – United States, 2021
Race, ethnicity, and socioeconomic status
Among adults, SSB intake is higher among males, young adults, non-Hispanic Black or Mexican American adults, or adults with low incomes.6910
Among youth, SSB intake is higher among boys, adolescents, non-Hispanic Black youth, or youth in families with low incomes.79
Geography
The prevalence of U.S. adults who drink sugary drinks at least once per day also differs geographically:
By region:
68% in the Northeast.
67% in the South.
61% in the West.
59% in the Midwest.11
By urban status:
About 31% in nonmetropolitan counties.
25% in metropolitan counties.12
Americans drink 52% of SSB calories at home, and 48% of SSB calories away from home.13
SSB consumption is associated with less healthy behaviors. Adults and adolescents who smoke, don’t get enough sleep, don’t exercise much, eat fast food often, and do not eat fruit regularly are more likely to be frequent consumers of SSBs. Additionally, adolescents who often drink SSBs also have more screen time, including more time with televisions, cell phones, computers, and video games.10141516
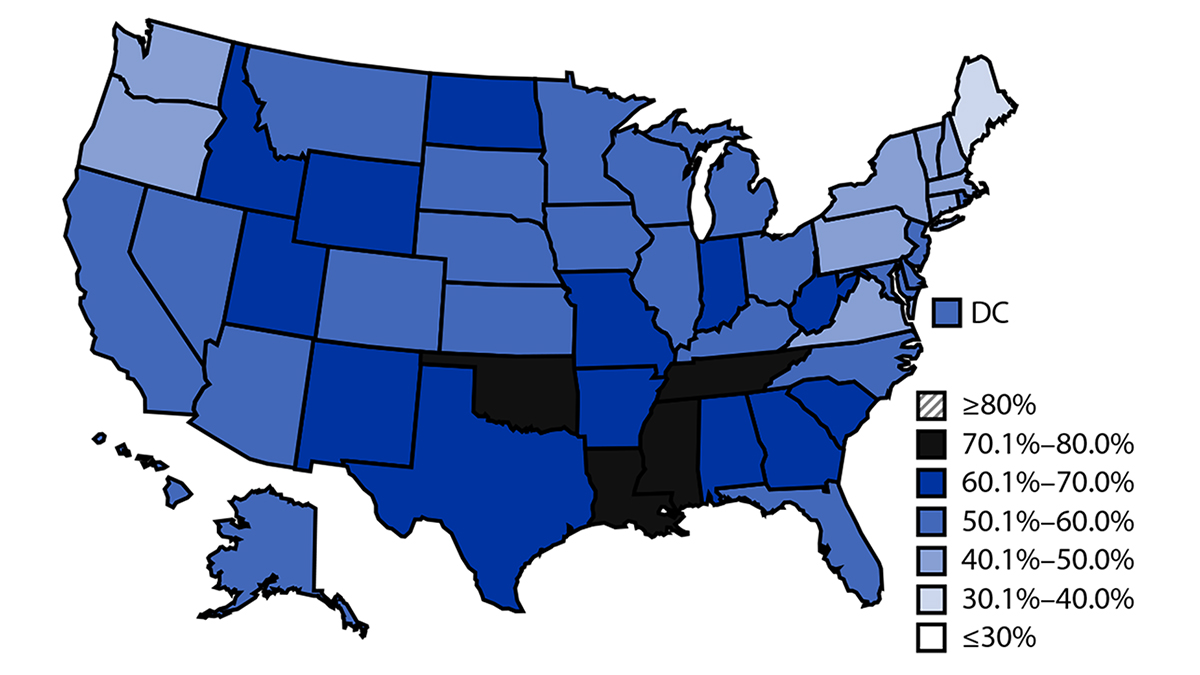
Data are from the National Health Interview Survey Cancer Control Supplement (NHIS CCS), 2010 and 2015.17 The map and data table below show combined 2010 and 2015 data.
Nationally, 63% of adults aged 18 or older reported drinking sugar-sweetened beverages one or more times daily. By state, SSB intake of 1 or more times daily ranged from 44.5% in Alaska to 76.4% in Hawaii.
Prevalence of self-reported intake of SSBs at least once daily among U.S. adults, 2010 and 201517