


The enzymes of the VK cycle are predominantly expressed in osteoblasts
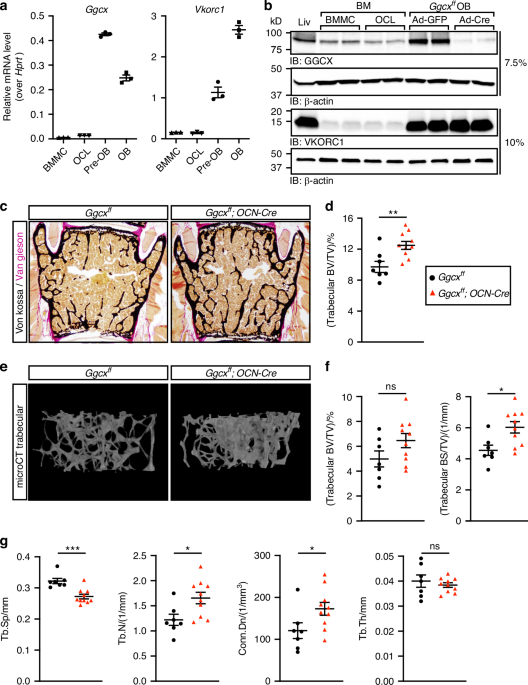
To identify the bone cell type(s) mediating the potential impact of VK on bone, we examined the expression of GGCX and VKORC1 in osteoblasts and osteoclasts at the mRNA and protein levels. Quantitative PCR (qPCR) revealed that Ggcx and Vkorc1 expression levels are about ten- to forty-fold higher in mouse proliferating non-mineralized osteoblasts (pre-OB) and in mineralized osteoblasts (OB) compared to bone marrow derived monocytes (BMMC) or fully differentiated osteoclasts (OCL) (Fig. 1a). Western blotting confirmed that GGCX and VKORC1 are more abundant in primary osteoblast cultures compared to osteoclasts. Interestingly, the expression level of GGCX and VKORC1 in osteoblasts was comparable to the one observed in liver where these enzymes are known to play a critical role in the γ-carboxylation and activation of several coagulation factors (Fig. 1b).
Fig. 1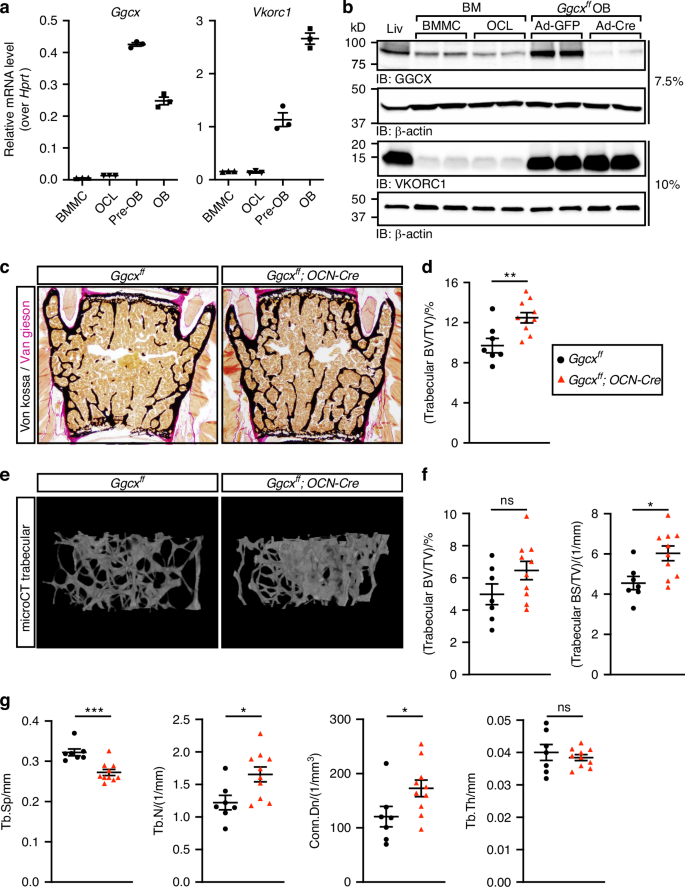 The alternative text for this image may have been generated using AI.
Increased bone mass in male mice lacking γ-carboxylation in osteoblasts. a Gene expression analysis by qPCR of Ggcx and Vkorc1 in bone marrow derived monocytes (BMMC), osteoclasts (OCL), proliferating pre-osteoblasts (pre-OB), and mineralized osteoblast (OB) cultures (n = 3). b Protein expression in liver (Liv) and bone cells by Western blot. GGCX was analyzed on a 7.5% SDS Tris Glycine gel using 20 μg of extracts, while VKORC1 was resolved on a 10% SDS Tris Tricine gel using 10 μg of extracts. c–g Six-month-old Ggcxff and Ggcxff;OCN-Cre male mice were analyzed (n = 7–10). c Representative pictures of sections from lumbar vertebrae stained with von Kossa and van Gieson. d Quantification of trabecular bone volume over tissue volume (BV/TV) from the L4 and L5 lumbar vertebrae sections. e Representative μCT images of the distal femur trabecular bones. f Quantification of trabecular bone volume (BV/TV) and trabecular bone surface density (BS/TV) from the μCT data. g Trabecular bone µCT derived data. Tb.Sp., Tb.N., and Tb.Th., trabecular spacing, number, and thickness respectively; Conn.Dn., connectivity density. Unpaired, 2-tailed Student’s t test was used in (d), (f), and (g). ***P < 0.001, **P < 0.01, *P < 0.05, ns: non-significant
Inactivation of GGCX in osteoblasts results in increased bone density in mice
Given the predominant expression of the VK-cycle enzymes in osteoblasts, we inactivated Ggcx specifically in this cell type and investigated the impact on bone remodeling. For this purpose, Ggcxfl/fl mice were bred with Osteocalcin-Cre (OCN-Cre) mice expressing the Cre recombinase in mature osteoblasts only.30 We previously reported that Ggcx was specifically and efficiently inactivated in osteoblasts in Ggcxfl/fl;OCN-Cre mice.31 The percentage of circulating carboxylated osteocalcin, an osteoblast-specific VK-dependent protein, was reduced by 80% to 90% between 2 and 6 months of age in these mice, confirming efficient inactivation of VK-dependent carboxylation in osteoblasts in vivo (Fig. S1). In a previous study, we reported that 3-month-old Ggcxfl/fl;OCN-Cre male mice had normal trabecular bone density.31 Since bone mass decreases with aging, we characterized the bone parameters of the Ggcxfl/fl;OCN-Cre male mice at 6 months of age when bone mass is declining in this species. Histological analysis of lumbar vertebrae indicated that trabecular bone density was significantly increased by about 30% in 6-month-old Ggcxfl/fl;OCN-Cre males (Fig. 1c, d). Microcomputed tomography (µCT) analysis indicated a significant increase in trabecular bone surface density (BS/TV), in the femur of Ggcxfl/fl;OCN-Cre mice, although trabecular bone density (BV/TV) was not significantly changed, likely due to higher variation (Fig. 1e, f). In addition, trabecular spacing (Tb.Sp) was significantly reduced, while trabecular number (Tb.N) and connectivity density (Conn.Dn), a computational measure of the inter-connectivity among trabeculae, were both significantly increased (Fig. 1g). Trabecular thickness (Tb. Th) was unaffected in Ggcxfl/fl;OCN-Cre femurs (Fig. 1g). Altogether, these data indicate that the absence of VK-dependent carboxylation in osteoblasts is associated with an increased bone mass at 6 months of age in male mice.
Decreased bone resorption in Ggcx
fl/fl;OCN-Cre mice
To get insight into the cellular mechanism behind the increased bone mass phenotype of the Ggcxfl/fl;OCN-Cre mice, static and dynamic bone histomorphometry analyses were performed at 6 months of age. Mineral apposition rate (MAR), measured using double calcein labeling, was slightly but significantly reduced in absence of GGCX in osteoblasts (Fig. 2a, b). However, bone formation rate (BFR/BS), osteoblast number (N.Ob/B.Pm), and osteoblast surface (Ob.S/BS) were not significantly affected (Fig. 2c–e). In contrast, both osteoclast number (N.Oc/B.Pm) and surface (Oc.S/BS) were significantly decreased in Ggcxfl/fl;OCN-Cre mice (Fig. 2f–h). Decrease circulating carboxy-terminal collagen crosslinks (CTX) independently confirmed reduced osteoclast activity in the same animals (Fig. 2i). Overall, these analyses suggest that the increased bone mass observed in the absence of γ-carboxylation in osteoblasts is mainly driven by a reduction in osteoclastic bone resorption.
Fig. 2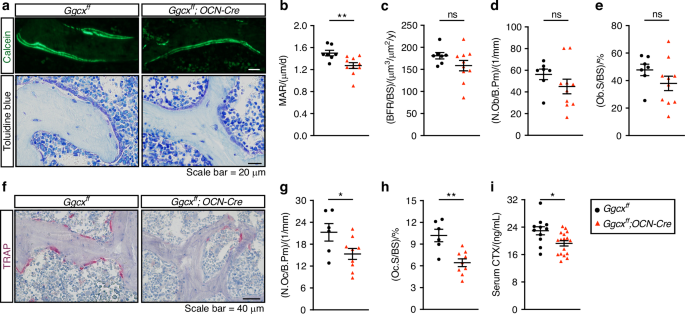 The alternative text for this image may have been generated using AI.
Reduced osteoclast number and surface in Ggcxff;OCN-Cre male mice. a–h Bone histomorphometry analysis of lumbar vertebrae in six-month-old Ggcxff and Ggcxff;OCN-Cre male mice (n = 6–10). a Representative pictures of calcein double labeling and toluidine blue staining. b Mineral apposition rate (MAR). c Bone formation rate over bone surface (BFR/BS). d Number of osteoblasts per bone perimeter (N.Ob/B.Pm). e Osteoblast surface over bone surface (Ob.S/BS). f Representative pictures of TRAP staining. g Number of osteoclasts per bone perimeter (N.Oc/B.Pm). h Osteoclast surface over bone surface (Oc.S/BS). i Fasting serum CTx levels (n = 12–17). Results represent the mean ± SEM. Unpaired, 2-tailed Student’s t test was used in (b–e) and (g–i). **P < 0.01, *P < 0.05, ns: non-significant
Decreased osteoclastogenesis in absence of Ggcx in osteoblasts ex vivo
Osteoclast differentiation is dependent on factors such as RANKL and M-CSF, produced by cells of the osteoblast lineage including pre-osteoblasts and osteocytes. Because of the reduction in osteoclast number in the Ggcxfl/fl;OCN-Cre mice, we hypothesized that Ggcx-deficient osteoblasts may be less efficient at supporting osteoclast differentiation or maturation. This was tested using co-cultures of wildtype bone marrow cells with either osteoblasts lacking GGCX (i.e., Ggcxfl/fl osteoblasts transduced with a CRE expressing adenovirus) or control osteoblasts (i.e., Ggcxfl/fl osteoblasts transduced with a GFP expressing adenovirus). We previously reported very efficient inactivation of GGCX in osteoblasts at the mRNA and protein levels using this approach31 (see also Fig. 1b). The coculture was performed in the presence of 1,25 vitamin D3 (VitD3) and prostaglandin E2 (PGE2), which promote the expression of pro-osteoclastogenic factors by osteoblasts. These experiments indicated that the number of osteoclasts was significantly reduced by approximately threefold in the co-cultures involving GGCX-deficient osteoblasts (Fig. 3a, b). This result suggests that γ-carboxylation in osteoblasts may regulate the production or the activity of a pro-osteoclastogenic factor. Importantly, the absence of osteocalcin (OCN), a γ-carboxylated protein specifically secreted by osteoblasts and osteocytes, did not affect the number of osteoclasts obtained from WT bone marrow cells (Fig. 3c, d).
Fig. 3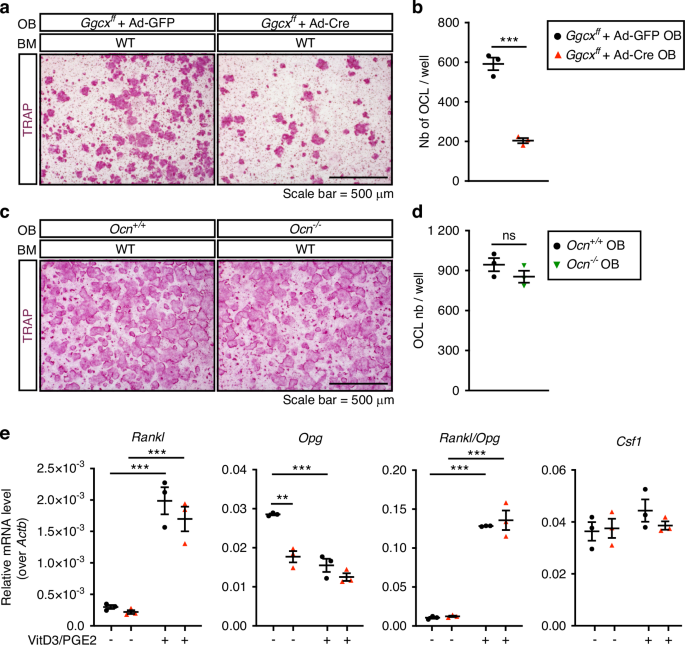 The alternative text for this image may have been generated using AI.
Ggcx inactivation impairs the ability of osteoblasts to support osteoclastogenesis ex vivo. a Representative TRAP staining of osteoblasts (OB) and bone marrow cells (BM) co-cultures at day 8 in the presence of prostaglandin E2 (PGE2; 10–6 mol/L) and 1,25 vitamin D3 (VitD3; 10–8 mol/L). Ggcxff osteoblasts were transduced with either Ad-GFP (control) or Ad-Cre (knockout) before the addition of the WT bone marrow cells. b Quantification of the number of TRAP+ osteoclasts per well (Nb of OCL/well) (n = 3). c Representative TRAP staining of osteoblasts and bone marrow cells co-cultures at day 8. Control (Ocn + /+) or osteocalcin-deficient (Ocn-/-) osteoblasts were cultured with WT bone marrow cells. d Quantification of the number of TRAP+ osteoclasts per well (Nb of OCL/well) (n = 3). e Gene expression analysis by qPCR in Ggcxff + Ad-GFP and Ggcxff + Ad-Cre osteoblasts cultured in presence (+) or absence (–) of PGE2 and VitD3 for 6 days. Results represent the mean ± SEM. Unpaired, 2-tailed Student’s t test was used in (b) and (d). Two-way ANOVA with Bonferroni’s posttests was used in (e). ***P < 0.001, **P < 0.01, *P < 0.05, ns: non-significant
Cells from the osteoblast lineage produce factors that promote (i.e., RANKL and M-CSF) or inhibit (i.e., osteoprotegerin; OPG) osteoclast generation. We assessed the expression of these factors in control and GGCX-deficient osteoblasts to determine if γ-carboxylation regulates the pro-osteoclastogenic potential of osteoblasts. qPCR revealed that as expected, VitD3 and PGE2, robustly increased the expression of Rankl and suppressed Opg expression (Fig. 3e). Consequently, the Rankl/Opg ratio, which is positively associated with osteoclast formation, was increased by more than tenfold in presence of VitD3 and PGE2. Importantly, the absence of Ggcx in osteoblasts had no significant impact on Rankl, Opg and the Rankl/Opg ratio in the pro-osteoclastogenic condition (Fig. 3e). In absence of VitD3 and PGE2, Opg expression was reduced (–38%) in GGCX-deficient osteoblasts, but this did not translate in a significant impact on the Rankl/Opg ratio, since the expression of Rankl was also decreased (–27%) in the same cells. The expression of Csf1, the gene encoding for M-CSF, was also unaffected in the absence of GGCX in osteoblasts (Fig. 3e). These data suggest that γ-carboxylation positively regulates osteoclast formation independently of osteocalcin and of the expression of known pro-osteoclastogenic factors.
The γ-carboxylated protein GAS6 is expressed and secreted by osteoblasts and activates its receptors on pre-osteoclasts
Based on the results obtained in vivo and in co-culture assays, we postulated the existence of a γ-carboxylated protein, different from osteocalcin, secreted by osteoblasts and promoting osteoclast formation. Expression of all known γ-carboxylated protein encoding genes was measured by qPCR in primary mouse osteoblasts. As expected, we detected expression of the γ-carboxylated ECM proteins osteocalcin (Ocn), matrix Gla protein (Mgp) and periostin (Postn), previously shown to be produced by the osteoblastic lineage (Fig. 4a).32,33,34 Earlier studies have established that inactivation of Mgp or Postn in mice had no impact on osteoclast number and surface,35,36 and our own data show that osteocalcin is not required for osteoclastogenesis in coculture assays (Fig. 3c, d). We therefore excluded these three proteins as potential mediators of the positive effect of γ-carboxylation on osteoclast formation. Of note, the γ-carboxylated coagulation factors and the Proline Rich and Gla domain 1 to 4 proteins (Prrg1-4) were undetectable in osteoblasts. However, the gene encoding Growth Arrest Specific 6 (Gas6) was expressed in osteoblasts and detected in the supernatant of osteoblasts cultured in pro-osteoclastogenic conditions (Fig. 4a and Fig. S2a).
Fig. 4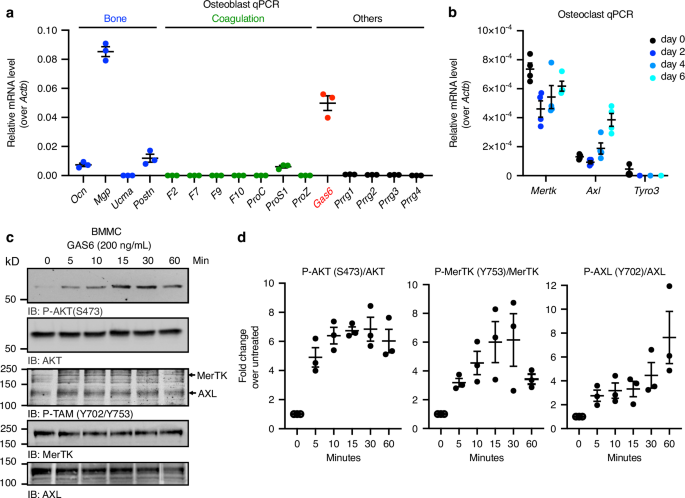 The alternative text for this image may have been generated using AI.
The γ-carboxylated protein GAS6 is expressed by osteoblasts and activates its receptors on pre-osteoclasts. a Expression analysis by qPCR of genes encoding the known γ-carboxylated proteins. Gas6 is highlighted in red. b Gene expression analysis by qPCR of the TAM receptors Axl, Mertk and Tyro3 in bone marrow derived monocytes (d0: day 0) and in differentiating osteoclast cultures in the presence of RANKL and M-CSF (d2-d6: day 2 to 6; n = 4). c Western blot analysis of the phosphorylation (P) of AKT (S473) and TAM (Y702 in AXL and Y753 in MerTK) in bone marrow derived monocytes (BMMC) serum starved for 3 h and treated with GAS6 (200 ng/mL) for the indicated times. Total AKT, MerTK, and AXL were used as loading controls. d Quantification of P-AKT (S473), P-MerTK (Y753), and P-AXL (Y702) normalized to the amount of total protein (n = 3). Results represent the mean ± SEM
GAS6 is a secreted γ-carboxylated protein that functions as a ligand for the TAM family of tyrosine kinase receptors that includes AXL, Tyro3, and MerTK. Given that GAS6 is a signaling molecule and that TAM receptors were previously shown to be present on myeloid cells in other tissues,37 we assessed the presence of functional GAS6 receptors at different stages of bone marrow-derived monocytes (BMMC) osteoclast differentiation. Both MerTK and Axl were detected in primary BMMC (d0) and in differentiating osteoclasts (d2, d4, and d6), while Tyro3 expression was below the detection limit in most samples (Fig. 4b).
We previously established that purified recombinant GAS6 (recGAS6) produced by HEK293 cells in presence of VK is fully γ-carboxylated and able to activate TAM receptors on muscle cells (Fig. S2b).38 We thus tested if this ligand could also elicit TAM receptors activation in primary pre-osteoclasts. For this purpose, BMMC were serum starved for 3 h, stimulated for various times with recGAS6 (200 ng/mL) and the phosphorylation of AXL and MerTK or their downstream target AKT39 assessed by Western blotting. Following recGAS6 stimulation, an increase in the phosphorylation of MerTK (Y753) and AXL (Y702) was detected (Fig. 4c, d). This tyrosine residue was previously shown to be a dominant autophosphorylation site in the tyrosine kinase domain of TAM receptors, which leads to the activation of their kinase activity.40 RecGAS6 also robustly induces the phosphorylation of AKT on serine 473, reflecting the activation of the phosphatidylinositol 3-kinase (PI3K) pathway (Fig. 4c, d). Together, these results support the existence of a functional GAS6-TAM signaling axis coupling osteoblasts to osteoclasts.
GAS6 signaling promotes osteoclast formation ex vivo
We then tested if GAS6-TAM signaling influences osteoclast formation using two approaches. In a first set of experiments, we assessed osteoclastogenesis in co-cultures of WT bone marrow cells and WT osteoblasts in the presence of increasing concentrations of two pharmacological TAM inhibitors, LDC1267 and R428 (bemcentinib).41,42 As shown in Fig. 5a, LDC1267, a pan-TAM inhibitor, dose dependently inhibits the formation of TRAP-positive multinucleated osteoclasts in these co-cultures, with an IC50 of ~750 nmol/L. R428, which is >50–100-fold more selective for AXL than MerTK and Tyro3, also inhibits osteoclast formation with a lower IC50 of ~250 nmol/L (Fig. 5b). These data suggest that TAM receptor signaling promotes osteoclast formation in co-culture assay.
Fig. 5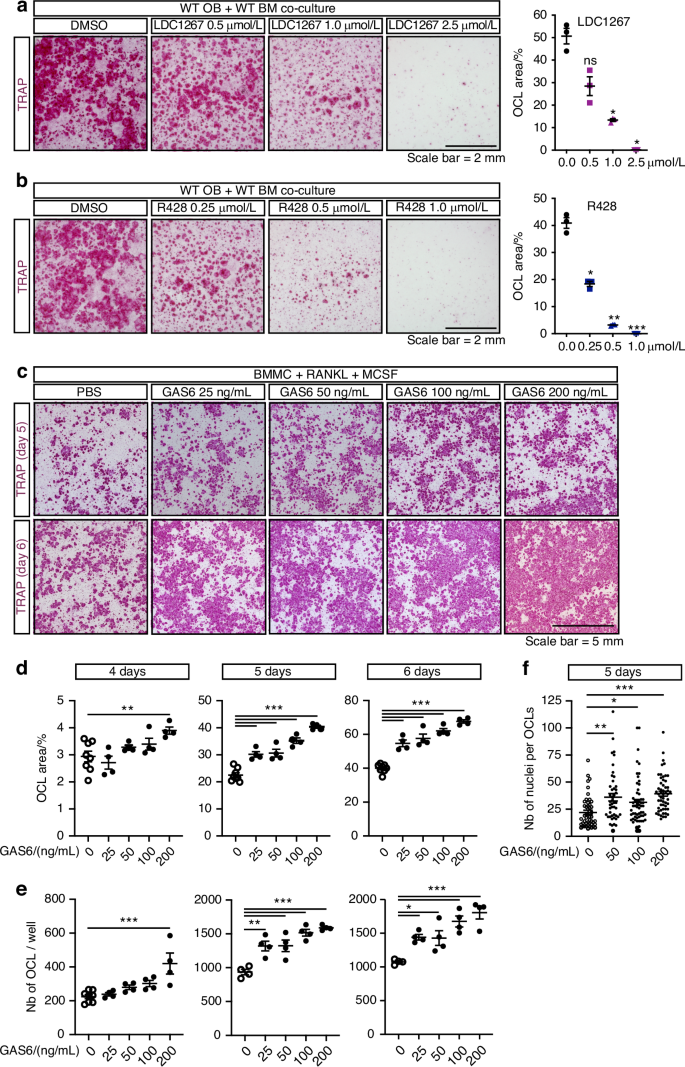 The alternative text for this image may have been generated using AI.
TAM signaling and γ-carboxylated GAS6 signaling promotes osteoclast formation in culture. Representative TRAP staining (left) and quantification of the TRAP+ osteoclast area (right) in WT osteoblast (OB) and bone marrow cell (BM) co-cultures at day 8 in the presence of PGE2 and VitD3, with or without the TAM inhibitors LDC1267 (a) or R428 (b), at the indicated concentrations. c–f Bone marrow derived monocytes (BMMC) were cultured in the presence of RANKL (20 ng/mL) and M-CSF (10 ng/mL) with or without recombinant γ-carboxylated GAS6 at the indicated concentrations for up to 6 days. c Representative TRAP staining at day 5 and 6 of differentiation. d Quantification of the TRAP+ osteoclast area at day 4, 5, and 6 of differentiation. e Quantification of the number of TRAP+ multinucleated osteoclasts at day 4, 5, and 6 of differentiation. f Quantification of the number of nuclei per osteoclast at day 5 of differentiation. Results represent the mean ± SEM. One-way ANOVA with Bonferroni’s posttests was used in (a, b) and (d–f). ***P < 0.001, **P < 0.01, *P < 0.05, ns: non-significant
In a second approach, we tested if exogenous recGAS6 (25–200 ng/mL) impacts osteoclast formation in primary BMMC cultures in the presence of RANKL (20 ng/mL) and M-CSF (10 ng/mL). In these experiments, recGAS6 significantly and dose-dependently increases osteoclast formation (Fig. 5c–e). Quantification of the cultures following TRAP staining indicated that recGAS6 increased both the surface covered by TRAP+ osteoclasts (Fig. 5d) and the number of multinucleated osteoclasts (Fig. 5e), as early as 4 days of culture when small multinucleated TRAP-positive osteoclasts begin to appear. In addition, the number of individual nuclei per osteoclast was significantly increased in presence of recGAS6 (Fig. 5f), indicating the formation of larger osteoclasts. Finally, supplementation of co-cultures of Ggcx-deficient osteoblasts and wild-type bone marrow cells with recGAS6 restored osteoclast numbers to levels comparable to controls (Fig. S3a–c). These findings demonstrate that GAS6 is sufficient to rescue the impaired osteoclastogenesis caused by Ggcx deletion and identify GAS6-TAM signaling as a modulator of osteoclastogenesis ex vivo.
GAS6 increases the fusion of pre-osteoclasts in culture
Osteoclast formation involves first, the transcriptional activation of a differentiation program in mononucleated pre-osteoclasts and second, their fusion to form mature multinucleated osteoclasts. We sought to determine if GAS6 signaling increases osteoclast formation by promoting differentiation of BMMC into osteoclasts. The expression of genes encoding several markers of osteoclast differentiation was measured by qPCR at 2, 4, and 6 days of differentiation in the absence or presence of intermediate doses of recGAS6 (i.e., 50 and 100 ng/mL). The presence of recGAS6 in the media did not significantly impact the expression of Acp5 (TRAP) and Clcn7 which gradually increase between 2 and 6 days of differentiation as expected (Fig. 6a, b). The highest dose of GAS6 (100 ng/mL) induces a small and significant increase in the expression of Ctsk, the gene encoding cathepsin K, at day 4 and 6 of differentiation, and of Dcstamp at day 6 of differentiation (Fig. 6c, d). Overall, this marginal impact of GAS6 on the expression of the osteoclast differentiation program cannot explain its strong positive effect on the generation of multinucleated osteoclasts in the same culture conditions. Indeed, 50 and 100 ng/mL of GAS6 increases by >50% the number of osteoclasts and the area of TRAP+ osteoclasts (Fig. 5c–e).
Fig. 6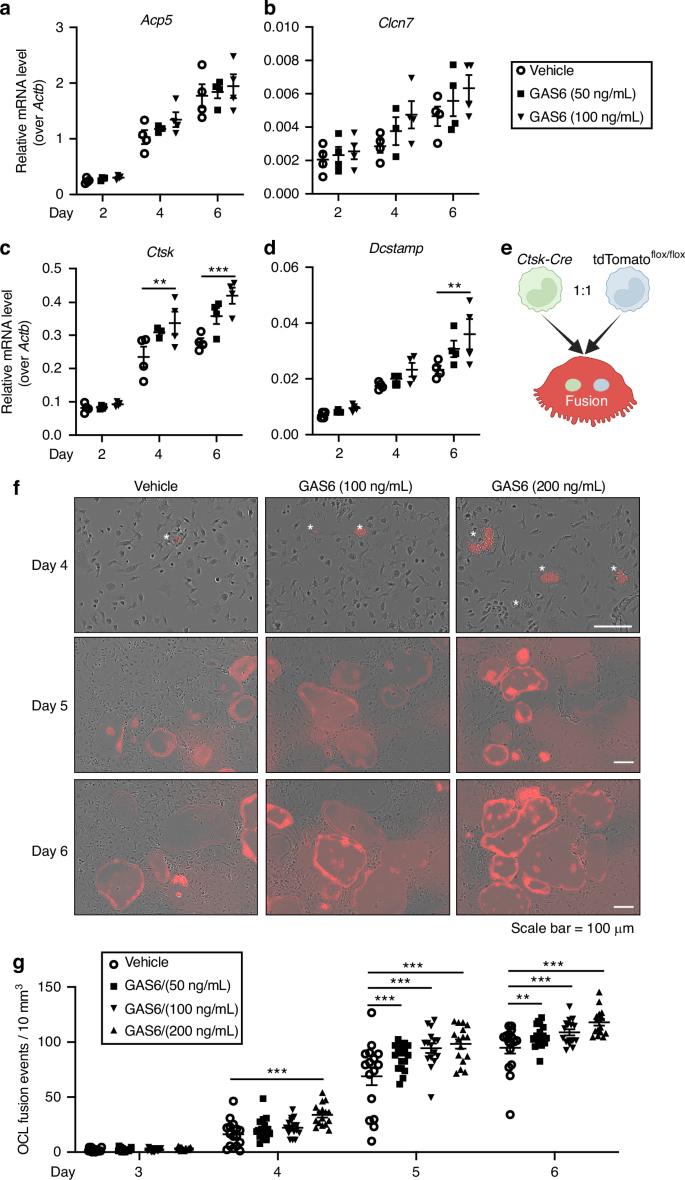 The alternative text for this image may have been generated using AI.
Gamma-carboxylated GAS6 impacts on osteoclast differentiation and fusion. a–d Gene expression analysis by qPCR of osteoclast differentiation markers Acp5 (TRAP), Clcn7, Ctsk, and Dcstamp. Bone marrow derived monocytes (BMMC) were cultured in the presence of RANKL (20 ng/mL) and M-CSF (10 ng/mL) with or without recombinant γ-carboxylated GAS6 at the indicated concentrations for 2, 4, and 6 days (n = 4 per condition). e Schematic representation of the assay used to assess the impact of γ-carboxylated GAS6 on pre-osteoclast fusion in culture using a conditionally activated tdTomato (Tom) reporter (created with BioRender). f Representative pictures of live osteoclast cultures at the indicated time and concentration of recombinant γ-carboxylated GAS6. The stars indicate the presence of fusion events (Tom+ cells) in presence of GAS6 at Day 4. g Quantification of the number of fusion events per 10 mm2 at the indicated time of osteoclasts differentiation (n = 16 fields per condition). Results represent the mean ± SEM. One-way ANOVA with Bonferroni’s posttests was used in (a–d) and (g). ***P < 0.001, **P < 0.01
Since recGAS6 increases the number of nuclei per OCL (Fig. 5f), we next tested if GAS6 promotes pre-osteoclast fusion. For this purpose, we established a pre-osteoclast fusion assay in which an equal number of CtskCre/+ and Rosa26CAG-lox-stop-lox-tdTomato BMMCs were induced to differentiate in osteoclasts. In this experimental setting, the fluorescent protein tdTomato (Tom) is only expressed in cells resulting from the fusion of at least one CtskCre/+ and one Rosa26CAG-lox-stop-lox-tdTomato pre-osteoclast (Fig. 6e). We then monitored using time-lapse microscopy the appearance of fluorescent Tom+ cells in the presence or absence of recGAS6. As shown in Fig. 6f, Tom+ cells begin to appear in osteoclast cultures at day 4 and increased in number considerably at day 5 and 6, validating our approach. Interestingly, the number of Tom+ cells was significantly higher in the presence of recGAS6 in the culture media even with the lowest dose tested (50 ng/mL), suggesting that GAS6 signaling promotes osteoclast fusion.
GAS6 promotes osteoclast formation and bone resorption in vivo
In addition to GAS6, protein S (Pros1) can also activate TAM receptors.43 Our data show that osteoblasts express Pros1 (Fig. 4a) and pre-osteoclasts express both Axl and Mertk (Fig. 4b). This redundancy in the TAM signaling system prevented us from assessing its role in osteoclast formation using a simple genetic loss-of-function model. Therefore, we employed a gain-of-function approach to evaluate the effect of increased GAS6 on osteoclastic bone resorption in vivo, using a previously described transgenic mouse line that expresses GAS6 under the human ApoE promoter.38 In these ApoE-Gas6Tg mice, GAS6 is produced by hepatocytes, fully carboxylated and secreted in the circulation, resulting in a fourfold increase in active GAS6 in serum (Fig. 7a). Because the skeleton, particularly the bone marrow cavity, is highly vascularized, we reasoned that this rise in circulating GAS6 should lead to higher concentration in the bone marrow, where osteoclast differentiation occurs. Consistent with this, GAS6 levels in the bone marrow were doubled in ApoE-Gas6Tg mice (Fig. 7b). We then examined bone density and remodeling in this GAS6 gain-of-function model.
Fig. 7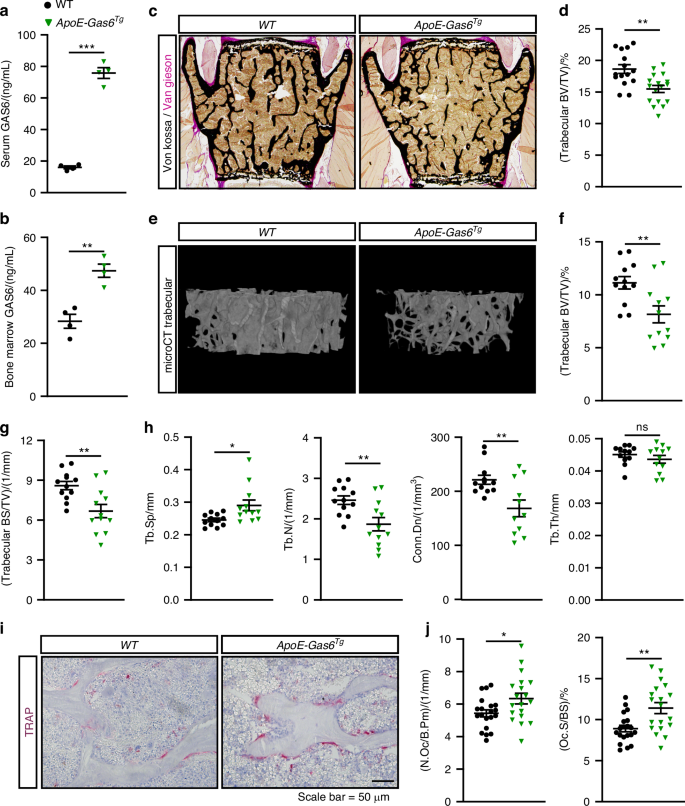 The alternative text for this image may have been generated using AI.
GAS6 promotes osteoclast formation and bone resorption in vivo. a–j Six-month-old WT (non-transgenic littermates) and ApoE-Gas6Tg male mice were analyzed. GAS6 concentration in the serum (a) and bone marrow cavity (b) (n = 4). c Representative pictures of sections from lumbar vertebrae stained with von Kossa and van Gieson. d Quantification of trabecular bone volume over tissue volume (BV/TV) from the L4 and L5 lumbar vertebrae sections (n = 15–17). e–h μCT analysis of the distal femur trabecular bone (n = 12). e Representative μCT images. f Quantification of trabecular bone volume (BV/TV). g Quantification of trabecular bone surface density (BS/TV). h Trabecular bone µCT derived data. Tb.Sp., Tb.N., and Tb.Th., trabecular spacing, number, and thickness, respectively; Conn.Dn., connectivity density. i–j Bone histomorphometry analysis of lumbar vertebrae in six-month-old WT and ApoE-Gas6Tg male (n = 19–20). i Representative pictures of TRAP staining. j Number of osteoclasts per bone perimeter (N.Oc/B.Pm) and osteoclast surface over bone surface (Oc.S/BS). Results represent the mean ± SEM. Unpaired, 2-tailed Student’s t test was used in (a, b, d, f–h and j). ***P < 0.001, **P < 0.01, *P < 0.05, ns: non-significant
Histology and µCT revealed a reduced trabecular bone volume (BV/TV) in vertebrae and femur of 6-month-old ApoE-Gas6Tg male mice compared to WT littermates (Fig. 7c–f). The µCT analyses showed that trabecular bone surface density (BS/TV) was also significantly reduced in the same animals (Fig. 7g). Trabecular spacing (Tb.Sp) was significantly increased and trabecular number (Tb.N) and connectivity density (Conn.Dn) significantly decreased, while trabecular thickness (Tb.Th) was unaffected in ApoE-Gas6Tg male mice (Fig. 7h). Static and dynamic bone histomorphometry indicated that ApoE-Gas6Tg male mice were characterized by a significant increase in both the number (N.Oc/B.Pm) and surface (Oc.S/BS) of osteoclasts in the trabecular bone (Fig. 7i–j). Importantly, bone formation parameters were unaffected in the same animals (Fig. S4a–d). Altogether, these data indicate that an increased concentration of GAS6 in the bone marrow is sufficient to stimulate the formation of osteoclasts in vivo, resulting in reduced bone density.