


Baseline model
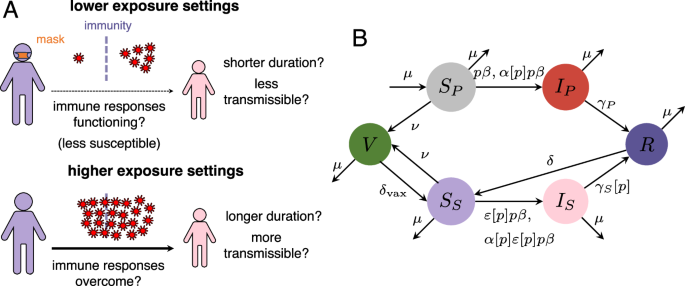
In line with real-world evidence for SARS-CoV-2, we first assume a relatively short duration of complete infection-derived or vaccinal immunity to infection. Furthermore, to allow for proper comparison with prior work on SIR/SIRS models11, we initially assume that primary and secondary infections are indistinguishable (i.e., same recovery rate and relative transmissibility, see ref. 7). Thus, if the susceptibility to primary and secondary infection is identical (ε = 1), our model is equivalent to an SIRS model. On the other hand, if the relative susceptibility to secondary infections is zero, our model reduces to an SIR model. We begin with the assumption that only the relative susceptibility to infection in previously-exposed individuals is dose-dependent.
In Fig. 2A–C, we examine potential endemic infection levels for low, medium, and high transmission scenarios, respectively, each as a function of both the relative transmission rate p and relative susceptibility to secondary infection ε. Since the quantitative details of the trade-off between immunity and exposure are unresolved, this approach allows us to visualize the effect of any functional dependence between these parameters. As examples, we illustratively represent three potential relationships on the heatmap for each transmission scenario. The first (in square symbols) denotes a setting where ε and p are independent, and this recapitulates previous modeling work with the SIRS model11. We then depict a more modest and a more pronounced immunity-exposure trade-off, in circle and triangular symbols, respectively. For these scenarios, a decrease in the NPI-induced relative transmission rate (driven by higher adherence or more effective NPIs) leads to a decrease in relative susceptibility to infection in previously-exposed individuals. Note that these relationships between p and ε are identical throughout and are independent of the endemic level of infections. Instead, we use these qualitative examples to determine the effects of a dependence between p and ε on endemic infection levels.
Fig. 2: Impacts of a transmission-exposure trade-off on endemic infection levels.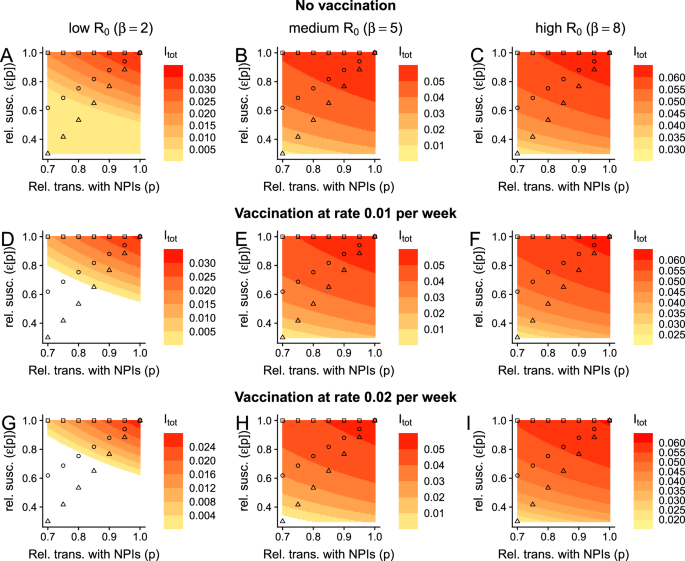 The alternative text for this image may have been generated using AI.
Each panel depicts the total fraction of the population that is infected, i.e., Itot = IP + IS at equilibrium as a function of the NPI-induced relative transmission rate and the relative susceptibility to infection in previously exposed individuals after complete immunity has waned. A–C depict scenarios with no vaccination (ν = 0), whereas D–F and G–I have vaccination at rate ν = 0.01 and ν = 0.02, respectively. Epidemiological outcomes in low-, medium-, and high-transmission settings are presented in (A, D, G), (B, E, H), and (C, F, I), respectively. The square, circle, and triangle markers represent, respectively, scenarios where there is no, a moderate, or a strong relationship between exposure and susceptibility to infection in previously exposed individuals. Throughout all panels, white regions are where Itot = 0, and other parameters are μ = 0.02 per year, \(\frac{1}{\delta }=\frac{1}{{\delta }_{{{\rm{vax}}}}}=0.25\) years, γP = γS = 1 per week, and α = 1. For the illustrative relationships between ε and p, depicted by squares, triangles, and circles, we use the functions ε□[p] = 1, \({\varepsilon }_{\bigtriangleup }[p]=\frac{7}{3}p-\frac{4}{3}\), and \({\varepsilon }_{\circ }[p]=\frac{7}{3}{p}^{\frac{1}{2}}-\frac{4}{3}\), respectively, for 0.7 ≤ p ≤ 1.
In low-transmission settings, without vaccination, and without an immunity-exposure trade-off, decreasing transmission has an appreciable effect on the endemic level of infection (Fig. 2A, square symbols), and this was thoroughly explored in previous work11. However, our analysis in Fig. 2A shows that a trade-off between immunity and exposure magnifies the dependence of endemic infection levels on the NPI-induced relative transmission rate (Fig. 2A, compare symbols). Thus, immune-driven dose-dependent susceptibility to infection can result in major quantitative differences in the number of infections at equilibrium, and the relative effectiveness of NPIs to reduce long-term burden will crucially hinge on the shape of this trade-off.
In high-transmission settings and without a trade-off between immunity and exposure, NPIs short of the elimination threshold have very limited effects in the long-term11. However, with such a trade-off, we find that important qualitative differences in outcomes emerge. In particular, this trade-off introduces a substantive decrease in equilibrium infection levels as the NPI-induced relative transmission rate increases (Fig. 2C). This dependence is rapidly magnified as the trade-off becomes more pronounced, i.e., as the relative susceptibility to infection in previously-exposed individuals decreases more rapidly with increasing NPIs.
Across transmission scenarios and irrespective of any underlying trade-off between immunity and exposure, we also find that vaccination decreases equilibrium levels of infections (Fig. 2, which echoes ref. 11). Furthermore, when there is a trade-off, vaccination accentuates the effects of dose-dependent infections (compare rows of Fig. 2). Thus, this result highlights the benefits of ongoing vaccination in conjunction with NPIs, and of increasing vaccine uptake (e.g., by decreasing hesitancy27,28).
Note that while we specify that ε could be a function of p, and we schematically illustrate possible relationships for specific examples (given by squares, circles, and triangles), our results, as presented in these heatmaps, are agnostic of specific relationships. Instead, the effect of any functional dependence of ε on p can be determined from the representations in Fig. 2. This approach is particularly powerful because we do not yet know the relationship between these parameters, and therefore motivates the importance of data collection to accurately measure this relationship.
Impacts of broadly-protective vaccines
Since infections and current SARS-CoV-2 vaccines likely provide very transient protection against infection, we also assume that the average duration of complete immunity is short-lasting. Furthermore, to enable comparisons between our model with those for the SIRS model with vaccination11 (i.e., so that our model reduces to the SIRS case when ε = 1), we have assumed that the duration of complete vaccinal immunity is identical to that of infection-induced immunity. However, there are large initiatives currently underway to develop broadly-protective SARS-CoV-2 vaccines29,30,31, which would hopefully provide longer-lasting substantial protection against infection (by conferring relevant protection against a larger number of possible variants). In Fig. 3, we examine the effects of a vaccine that completely protects an individual from infection for a year on average. We surprisingly find that such a vaccine accentuates the effects of a trade-off between exposure and relative susceptibility (compare Fig. 3A–D with Fig. 2E, F, H, I, respectively). In particular, in these settings and as p decreases, infection levels have a more pronounced decline. Furthermore, in these medium- and high-transmission settings, high vaccination rates combined with NPIs can result in local elimination. If complete vaccinal immunity lasts instead 2 years on average, these features are further amplified (Fig. S1).
Fig. 3: Effects of a broadly-protective vaccine on the implications of a trade-off between immunity and exposure.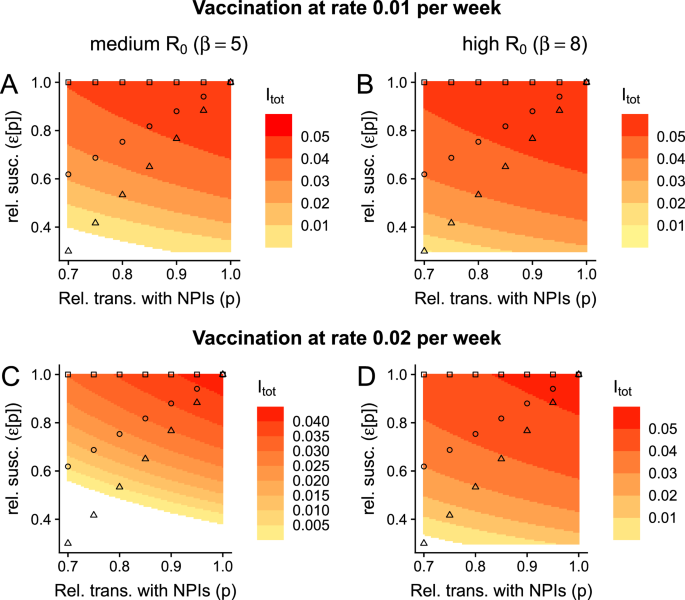 The alternative text for this image may have been generated using AI.
Here, we assume that a vaccine imparts complete immunity for an average of a year, i.e., \(\frac{1}{{\delta }_{{{\rm{vax}}}}}=1\) year. A, C denote a medium-transmission setting, whereas B, D denote a high-transmission setting. Furthermore, in A, B, ν = 0.01 per week, whereas ν = 0.02 per week in (C, D). All other details and parameters are as in Fig. 2.
Lower exposure decreases duration of infection in previously-immune individuals
So far, we have assumed that only the relative susceptibility to infection of previously-exposed individuals is dose-dependent, and that the characteristics of an infection in these individuals are identical to those in never-exposed infected individuals. In particular, and as in prior work, we have taken secondary infections to have the same transmissibility and duration as that of primary infections (i.e., α = 1 and γS = γP, respectively, see e.g., refs. 7,16). However, in previously exposed individuals, prior immunity could act to decrease the duration of infection or reduce its transmissibility, especially in lower-exposure settings. Thus, these features could also be dose-dependent, i.e., decrease with lower exposure. In Fig. 4A–C, we explore the impact of dose-dependent duration of infections in previously exposed individuals. As in Figs. 2 and 3, we examine equilibrium infection levels for a range of NPI-induced relative transmission rates, relative susceptibility rates, and durations of secondary infection. In Fig. 4, we also present the illustrative relationships between immunity and exposure from Fig. 2 and expand these so that the duration of secondary infections decreases with lower exposure. To allow for appropriate comparison between scenarios, we assume that these illustrative schematics (i.e., shown with the squares, circles, and triangles) depict the same relationship between duration of secondary infection i.e., \(\left(\frac{1}{{\gamma }_{S}}\right)\) and p.
Fig. 4: Effect of dose-dependent duration of infection (in previously exposed individuals) on the implications of NPI-induced reductions in exposure.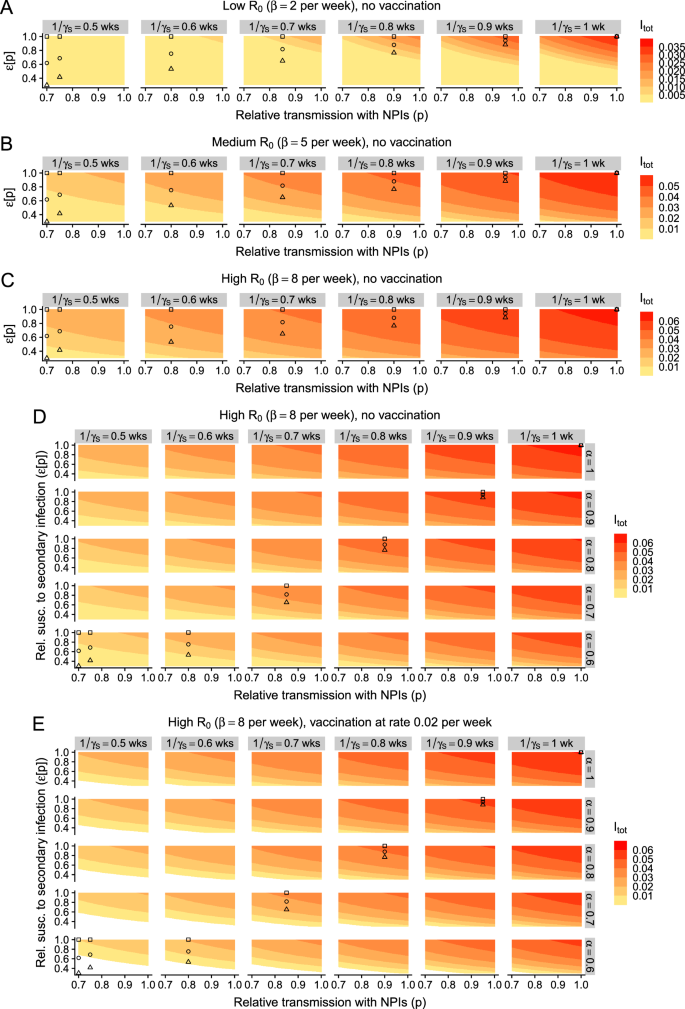 The alternative text for this image may have been generated using AI.
A Low-transmission setting with no vaccination, B medium-transmission setting with no vaccination, C high-transmission setting with no vaccination. D, E: Outcomes in high-transmission settings with a combination of dose-dependent relative susceptibility to secondary infection ε, duration of secondary infection \(\frac{1}{{\gamma }_{S}}\), and relative transmissibility of secondary infection α. Additionally, D, E depict scenarios with no vaccination and vaccination at a rate of ν = 0.02 per week, respectively. All details and other parameters are as in Fig. 2.
In the absence of a decrease in relative susceptibility to secondary infection, we also find that a trade-off between exposure and the duration of secondary infection has a qualitatively similar effect on the equilibrium number of infections (Fig. 4A–C, square symbols). In low-transmission settings, moderate reductions in the duration of secondary infection cause a substantive reduction in infection levels (Fig. 4A). While this effect is dampened as transmission increases, it nevertheless persists (compare Fig. 4A–C). Importantly, such a reduction in duration of secondary infections even leads to more marked reductions in infection levels than if exposure only affects relative susceptibility to secondary infection. Thus, it is imperative to quantify the duration of secondary infections as a function of exposure levels.
Overall, when relative susceptibility decreases as exposure decreases, we find that a dose-dependent duration of secondary infection heightens our previously observed effects (compare plots within each panel of Fig. 4A–C from right to left). In these settings, vaccination also functions to augment the potential effects of a trade-off between immunity and exposure (Figs. S2 and S3). Finally, these are then themselves further magnified if the duration of complete vaccinal immunity is increased via a broadly-protective vaccine (Figs. S4, S5 and S7, S8).
Lower exposure decreases relative transmissibility of infections in priorly-immune individuals
While prior immunity could decrease the duration of secondary infections, it may also act to reduce the relative transmissibility of these infections. In Fig. 4D, E, we explore this in detail for high-transmission settings. If the relative transmissibility of secondary infections is also dose-dependent, the effects of any trade-off between immunity and exposure are again further amplified. However, the decrease in infection levels that is induced via a decrease in relative transmissibility alone appears to be more moderate than those due to a decrease in relative susceptibility or a decrease in duration of secondary infection (compare rows in Fig. 4D with the top panel in each column, and the top row with the rightmost column in Fig. 4D, respectively). In line with our previous results, vaccination accentuates any trade-off between immunity and exposure (compare Fig. 4E with 4D), and this is boosted further if a vaccine confers durable complete immunity (Figs. S6 and S9).
Summary
To summarize our results, we present in Fig. 5 the impacts on endemic infection levels for the three illustrative trade-offs (Fig. 5A, i.e., depicted by squares, circles, and triangles in Figs. 2, 3) compounded with the potential additional dependence of the duration (Fig. 5B) and relative transmissibility (Fig. 5C) of secondary infections on dose. Even when only the relative susceptibility to secondary infections is dose-dependent, NPIs can decrease infection levels substantially, and the benefits per increase in NPI usage are nonlinear (Fig. 5D, leftmost column). If additional immune parameters are also dose-dependent, NPI usage further decreases endemic infections and can even lead to local elimination (Fig. 5D, middle and rightmost columns). Thus, this highlights the potential additional benefit of NPIs. Taken together, our results highlight the urgent need to characterize the shape of immunity-transmission trade-offs to guide public health recommendations.
Fig. 5: Summary illustrative schematic for the impacts of a dose-dependence on secondary infection characteristics.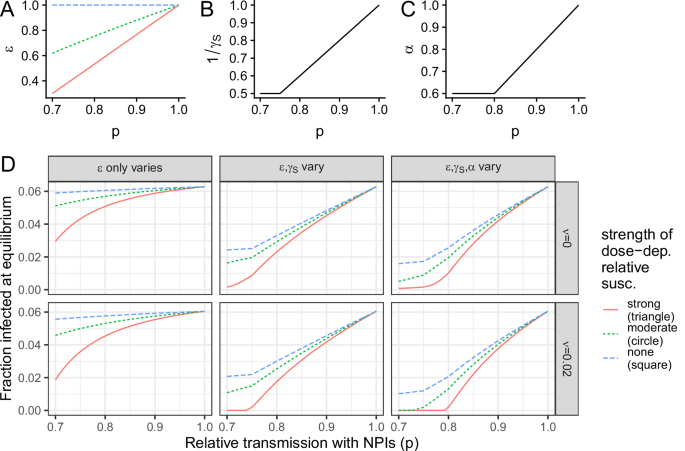 The alternative text for this image may have been generated using AI.
A Relationship between relative susceptibility (ε) and relative transmission with NPIs (p), for strong, moderate, and no dose-dependence, which are as the relationship depicted in Figs. 2 and 3 by circles, triangles, and squares, respectively. Relationship between the average duration (B) or the relative transmissibility (C) of a secondary infection as a function of the relative transmission with NPIs (p), as taken for all three illustrative relationships (i.e., circles, triangles, and squares) depicted in the relevant panels of Fig. 3. D Endemic infection levels in different settings, including which parameters are dose-dependent (columns) and whether there is vaccination (row).