


HomeHunger & UndernourishmentWhat can countries with high stunting rates today learn from Japan’s experience of going from 70% to 5%?
One in four children in the world today suffers from stunting. That’s 150 million children under five years old.
A child is considered stunted if they are too short for their age. It is a consequence of malnutrition. Here, we’re not simply talking about children who are slightly smaller than their peers, but those who are shorter than the medically acceptable range for healthy growth.1
Stunting reflects poor nutrition and frequent exposure to disease or illness, which reduces their ability to retain nutrients and increases their requirements. Stunting suggests that a child’s development has been hindered, and its impacts are not limited to childhood: it affects both physical and cognitive progress and can persist throughout a person’s life.
For more technical details, read my short explainer on childhood stunting.
Looking at rates across the world today, we see huge differences: stunting has been almost eliminated in some countries, but there are still many in Asia and Africa where it affects more than a third of children.
This raises the question of when and how stunting was reduced in the places where it’s rare today.
A new crucial dataset gives us some answers.
Until now, researchers had only high-quality data on stunting rates dating back to the 1990s. But a major effort by Eric Schneider and colleagues filled this gap by carefully collecting records that allow us to see how things have changed over more than a century.2
The data they published in their recent paper shows that childhood stunting fell dramatically across many countries over the 20th century. You can explore this data via the chart below.
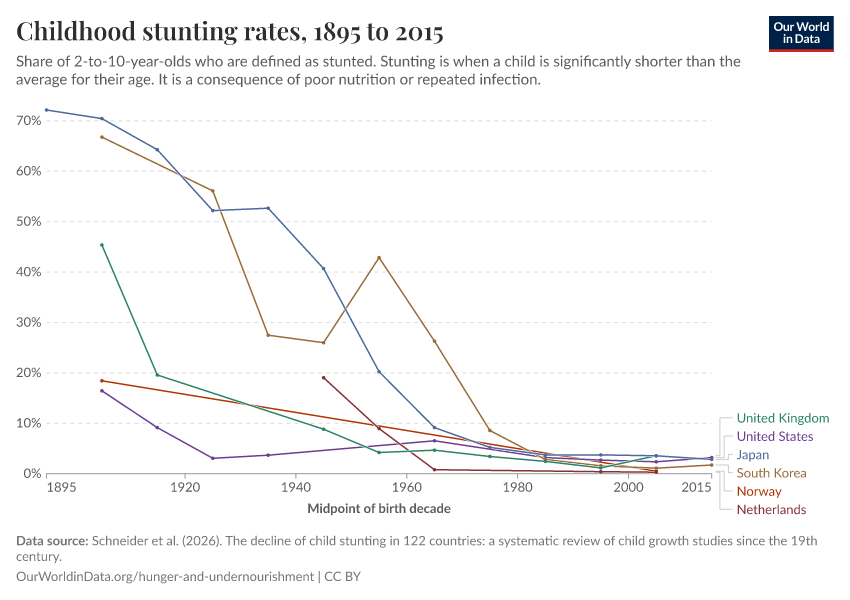
By the 1990s, when many high-income nations had reduced stunting rates to under 10%, it was still a huge problem in many low-to-middle-income countries.
However, they have also made progress. In the chart below, you can see stunting rates for a selection of middle-income countries. You can explore many more countries via the interactive chart.
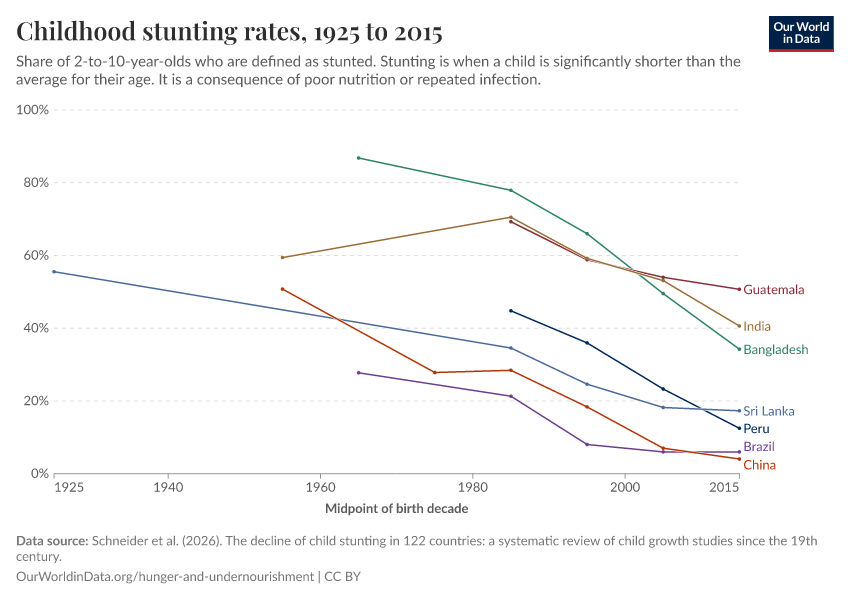
Note that this historical data is based on children aged 2 to 10, and the latest data point is from the 2010s. Commonly updated metrics focus on children under 5, making it difficult to directly compare these long-run historical rates to those today. However, the broad picture is similar: modern stunting rates in rich countries are incredibly low, while in low- and middle-income countries, it’s typical for more than a fifth of children to be stunted (and in some cases more than a third).
This long-run data, in itself, shows that child health can improve dramatically, and that high rates of stunting are not inevitable.
To understand how progress is possible, I want to zoom in on one country: Japan.
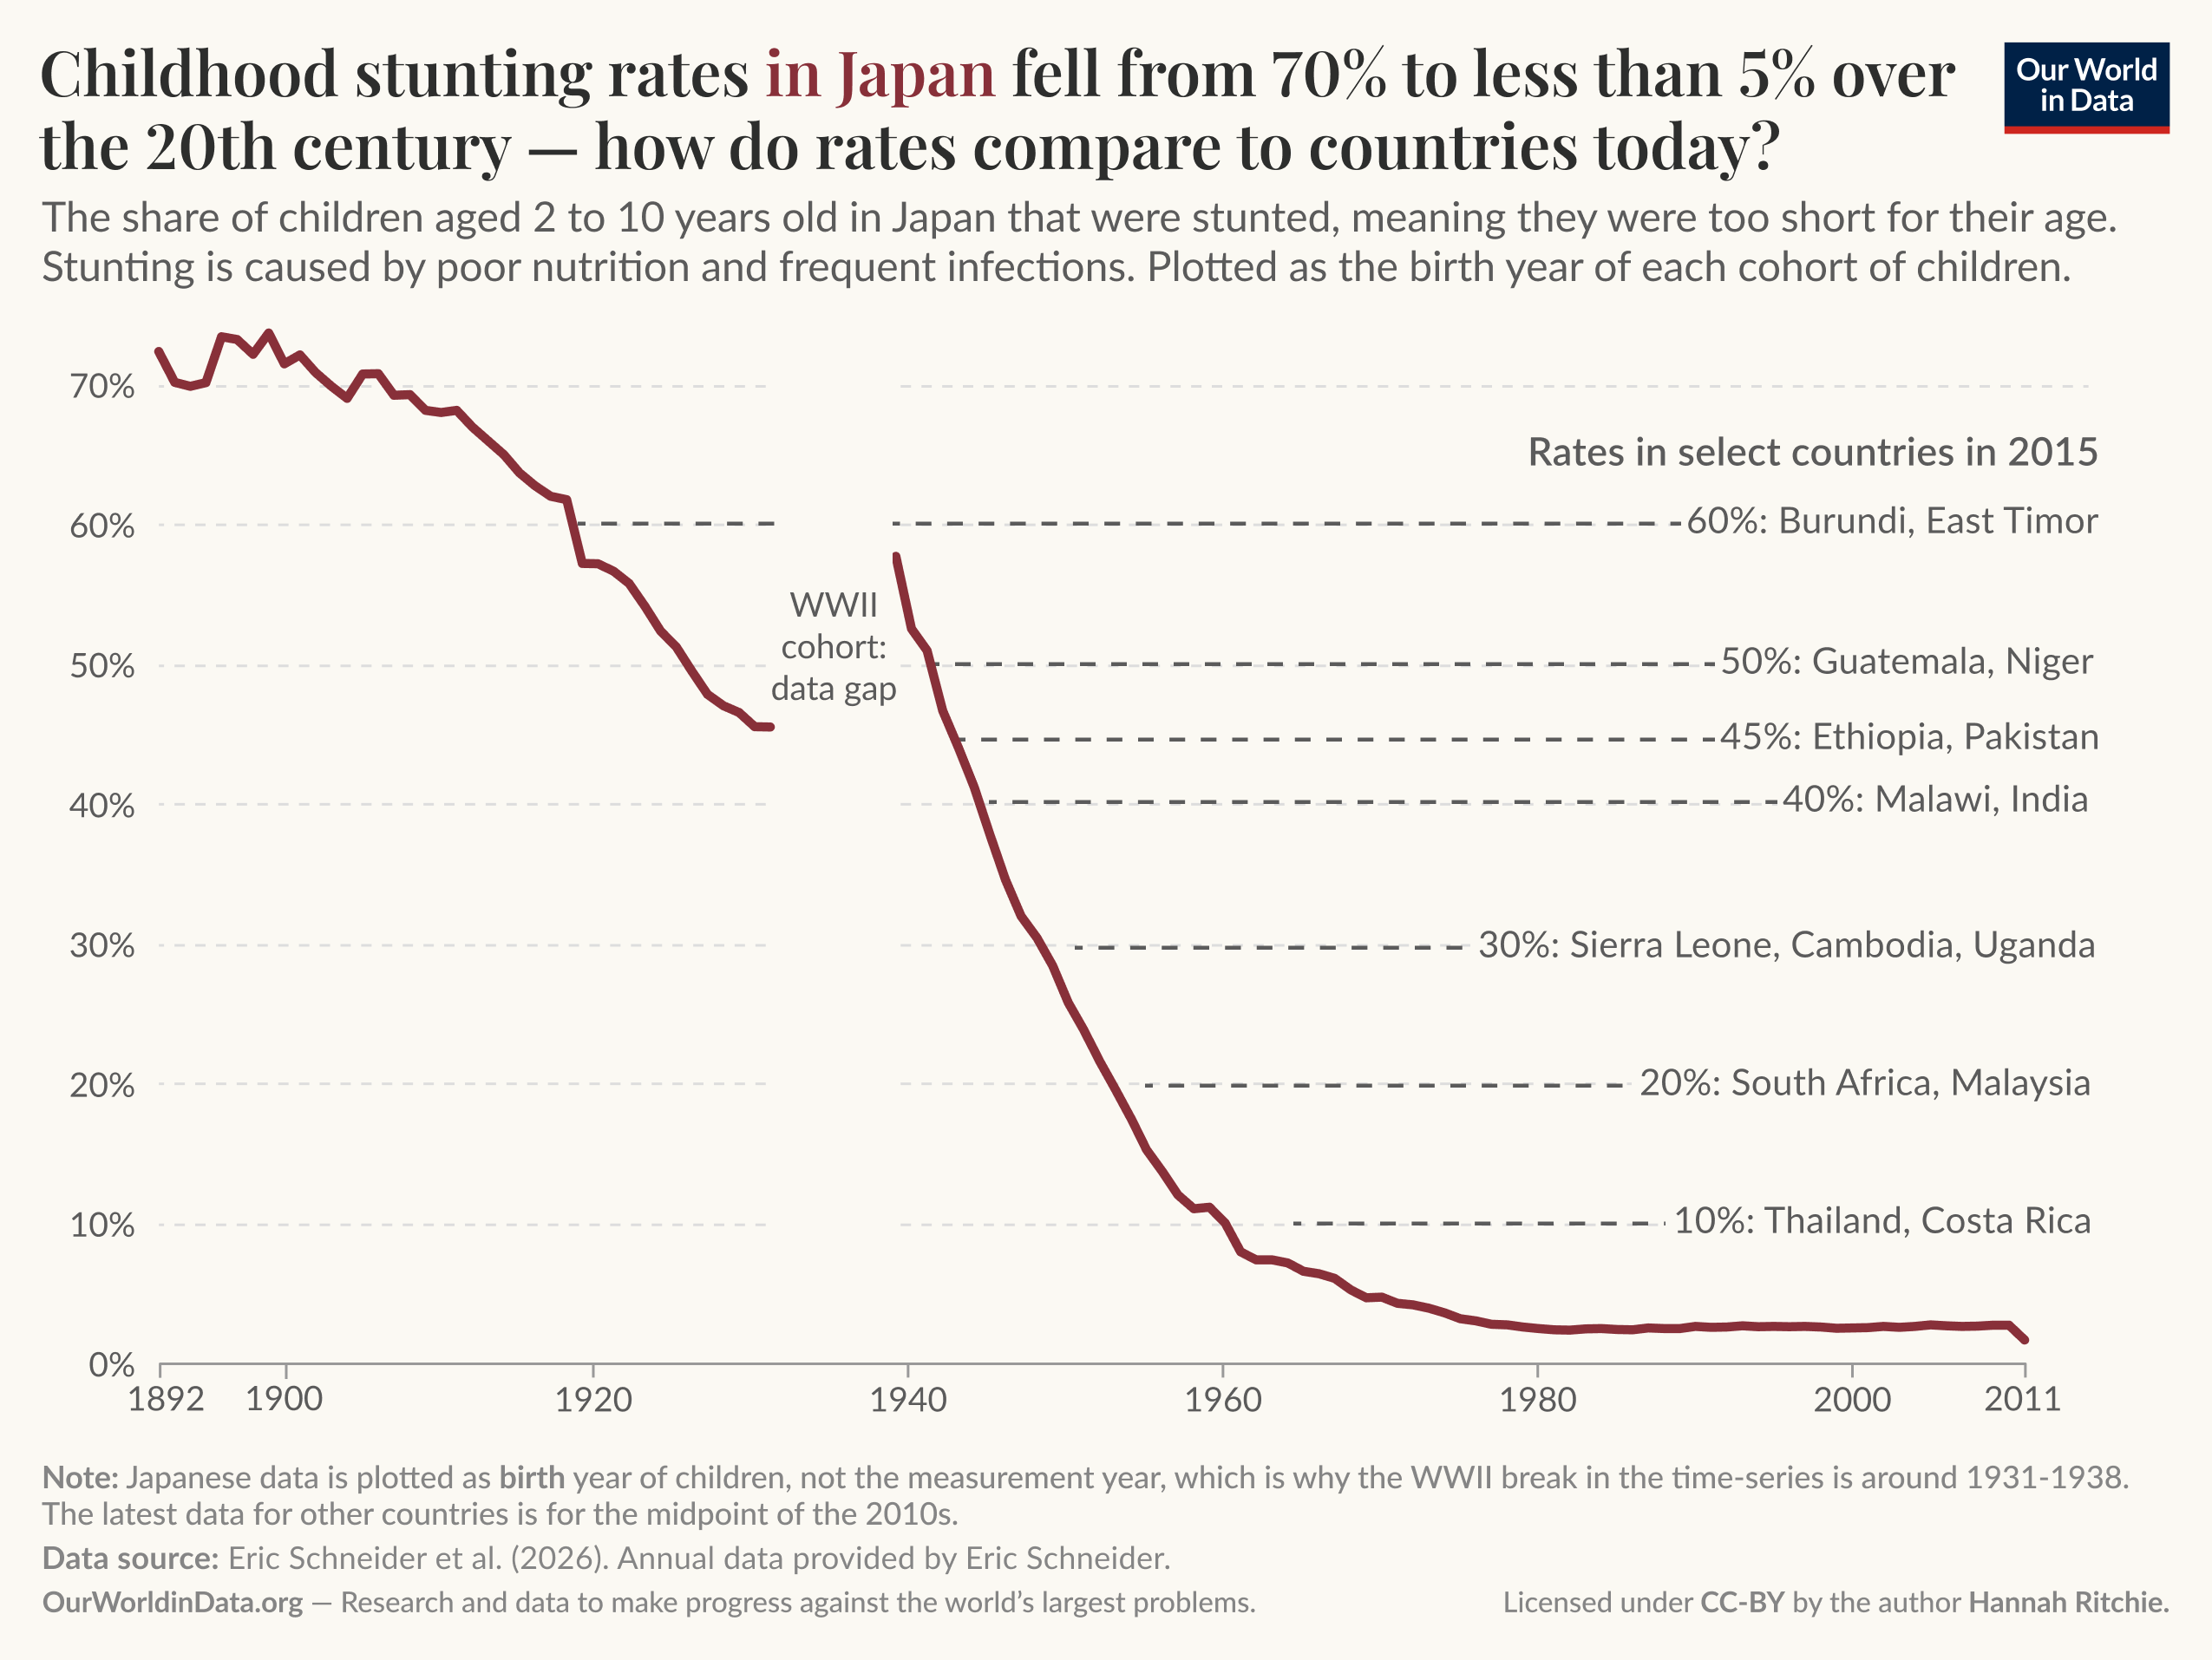
At the beginning of the 20th century, more than 70% of Japanese children were stunted. Today, very few are.
The fact that we have this long-run data showing Japan’s path from widespread to low levels of stunting means we can contextualize and understand where many low- and middle-income countries now sit in this historical trajectory.
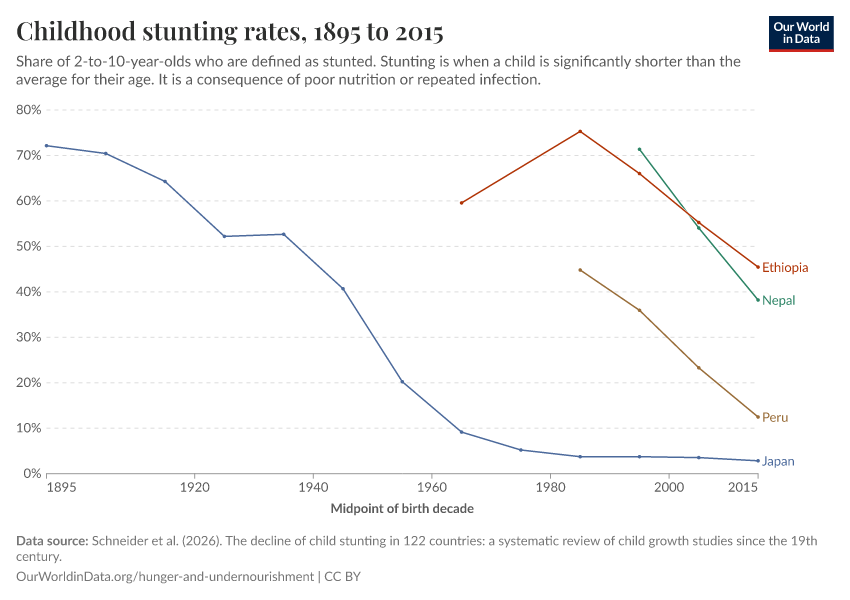
The chart below shows Japan’s decline in stunting over the last hundred years alongside rates across a selection of countries in the 2010s. Japan has such high-quality data that we can plot this as an annual series.3 Note that the data is based on the birth year of each cohort of children, not the measurement year (which is why the gap during the Second World War appears earlier than expected).
You can see, for example, that today Burundi and East Timor have rates comparable to Japan in the 1920s. Malawi and India to Japan in the 1940s.
Understanding the interventions and changes in Japan at each level of stunting could offer valuable lessons for countries at different stages of their own journey.
It’s useful to break Japan’s timeline into a few key periods: the early 1900s, before the Second World War, when stunting declined at a moderate pace; the war itself, when progress stalled; and then the post-war period, where stunting fell dramatically.
In the early 1900s, stunting rates fell from around 70% to 40–45% by the early 1940s. Rates were falling at around 0.8 percentage points per year, on average.
At the beginning of the 20th century, more than 70% of Japanese children were stunted.
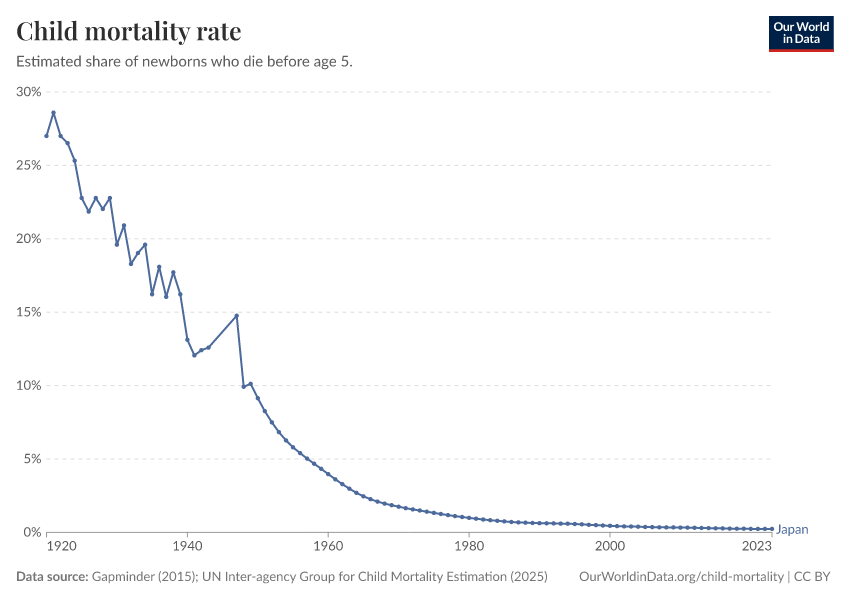
While improvements in nutrition played a crucial role in reducing stunting after the war, the research suggests that, in this pre-war period, tackling infectious disease was more important.4 Over the first half of the 20th century, deaths from gastrointestinal diseases in Japan fell substantially. Across the country, rates fell by roughly 40%, and in major cities they more than halved in just a decade.5
A big part of this progress came from the expansion of piped water.6 In Tokyo, the share of households with access to a water supply increased from around 30% in 1920 to 80% in the mid-1930s.
Researchers have estimated that this clean water buildout accounted for 30% to 40% of the reduction in child mortality and infectious disease deaths over this period.5
What does this mean for countries with pre-war-Japan levels of stunting today?
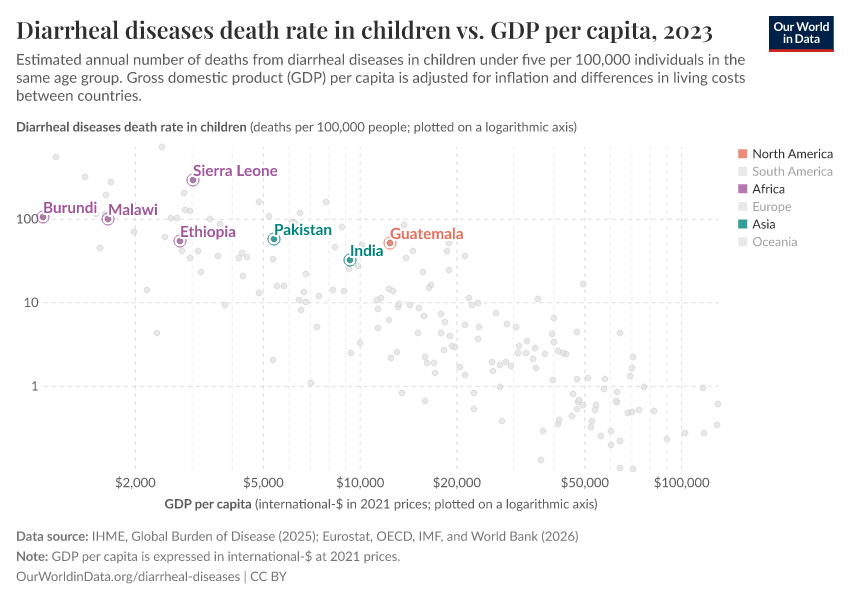
If we look at some of the countries with very high stunting rates, we see that child deaths from diarrheal diseases are common. Some of them are highlighted in the chart below, where several stand out as having higher death rates than other countries at similar incomes.
Japan’s history suggests that these countries could reduce childhood stunting by focusing on controlling infectious diseases through the expansion of clean water, safe sanitation, and hygiene facilities.
 World War II reversal
Before moving on to Japan’s steep decline in stunting after the Second World War, it’s worth noting that progress stalled and may even have reversed during the war’s latter stages.
The research suggests that there was a temporary, and quite severe, reversal in nutritional levels.7
The average daily supply of calories dropped from around 2,100 kcal in 1941 to less than 1,800 kcal in 1945.8 Surveys from Tokyo in the final stages of the war reported that the vast majority of children were eating one meal a day or less.
Data collection was much more limited during the war, which is why you see a gap in the earlier time series for Japan. But this chart also shows that stunting levels were higher after the war than before it.
What’s interesting about this cohort of stunted Japanese children is that they managed to catch up with their peers later in childhood.9 By adulthood, they were just as tall. This suggests that when conditions improve, children can recover from early nutritional shocks during later childhood, not just in the first few years of life.10
This has important implications for policy: if catch-up growth is possible (which is what this Japanese data suggests), preventing deficiencies in the first place is cheaper and more beneficial, but improving nutrition throughout childhood still gives children the opportunity to close the gap.
After the war, the decline in stunting accelerated, averaging around 2.2 percentage points per year.
The pre-war period tackled disease; the post-war period tackled disease and diet at the same time, which is why progress was nearly three times faster.
Japanese public health researchers later described Japan as “the paradise of parasites” during this period.11 As many as 7 in 10 people living in rural areas were infected with roundworm and hookworm, parasites that live in the intestine and prevent nutrients from being absorbed properly.12 Other infectious diseases were also rampant.
But in the thirty years following the war, things changed. Japan effectively eliminated diseases such as hookworm, ascariasis, and malaria, and saw a significant drop in diarrheal disease. This was the result of significant investments in scaling up clean water supplies and sanitation, deworming programs in schools, and hygiene education.
Between 1950 and 1980, the share of people with clean piped water increased from less than 30% to over 80%.13
Another, unappreciated change was the transition from “nightsoil” to chemical fertilizers.
For much of the 20th century, Japanese agriculture relied heavily on human excrement (nightsoil) as a nutrient source.14 Before the Second World War, some of this was displaced by synthetic chemical fertilizers, but during the war, these supplies were almost completely cut off. This practice was a key source of parasitic infection, particularly hookworm, among rural populations. Parasite eggs from the excrement could survive in the soil for weeks; people then ingested them either through eating vegetables and other foods grown in the fields, or through larvae penetrating the skin of people working in the fields. In the post-war decades, chemical fertilizers gradually replaced nightsoil again, breaking the transmission chain of these parasites through agriculture. Exposure to infectious diseases dropped significantly.
In most countries with stunting rates in the 5% to 40% range today, tackling infectious diseases through expanded access to safe water, sanitation, and hygiene practices is crucial. Death rates attributable to a lack of these resources are still very high relative to where Japan is today. Diseases such as filariasis, caused by parasitic worms, are still common.
Between 1950 and 1980, the share of people with clean piped water increased from less than 30% to over 80%.
Japan achieved this by building out infrastructure and education programs on the importance of hygiene practices. This was a crucial part of the country’s strategy, particularly in schools.
Reductions in stunting were so fast, not just because disease burden declined and children could retain nutrients more easily, but also because nutritional intakes improved.
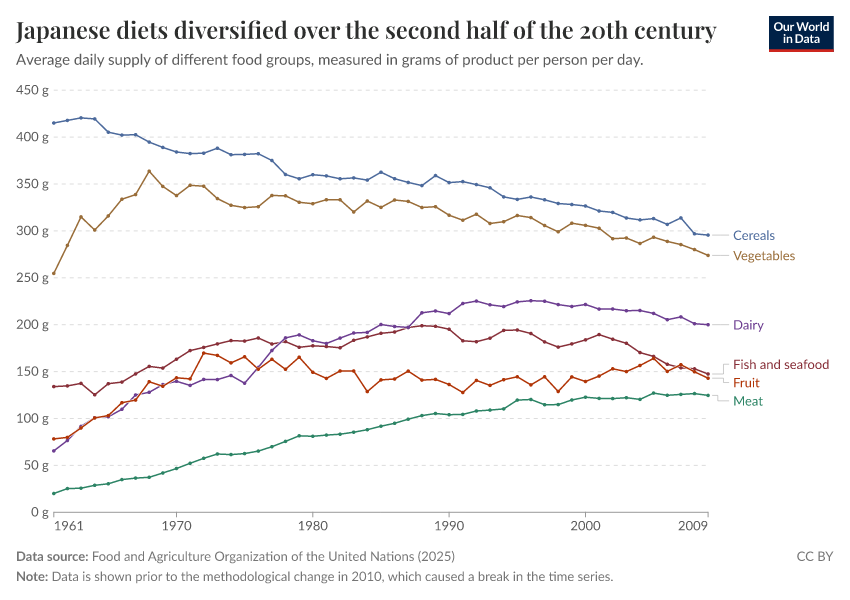
Over the second half of the 20th century, food consumption in Japan shifted from being heavily reliant on staples such as rice and cereals to one with more meat, seafood, and fruit. In the chart below, you can see this transition, measured as the average daily supply of different food groups since 1961 (the earliest year for which data is available).
Not only did total calorie intake increase after the war, but this diversification also increased consumption of crucial micronutrients and high-quality proteins, which had previously been missing from a monotonous, cereal-dominant diet.
The American occupation of Japan in the years after the war had a positive influence on these nutritional trends. From the late 1940s to the early 1950s, the United States provided large food aid programs. These programs increased total consumption but also made foods such as bread and milk staples in the Japanese diet, where they hadn’t been before.
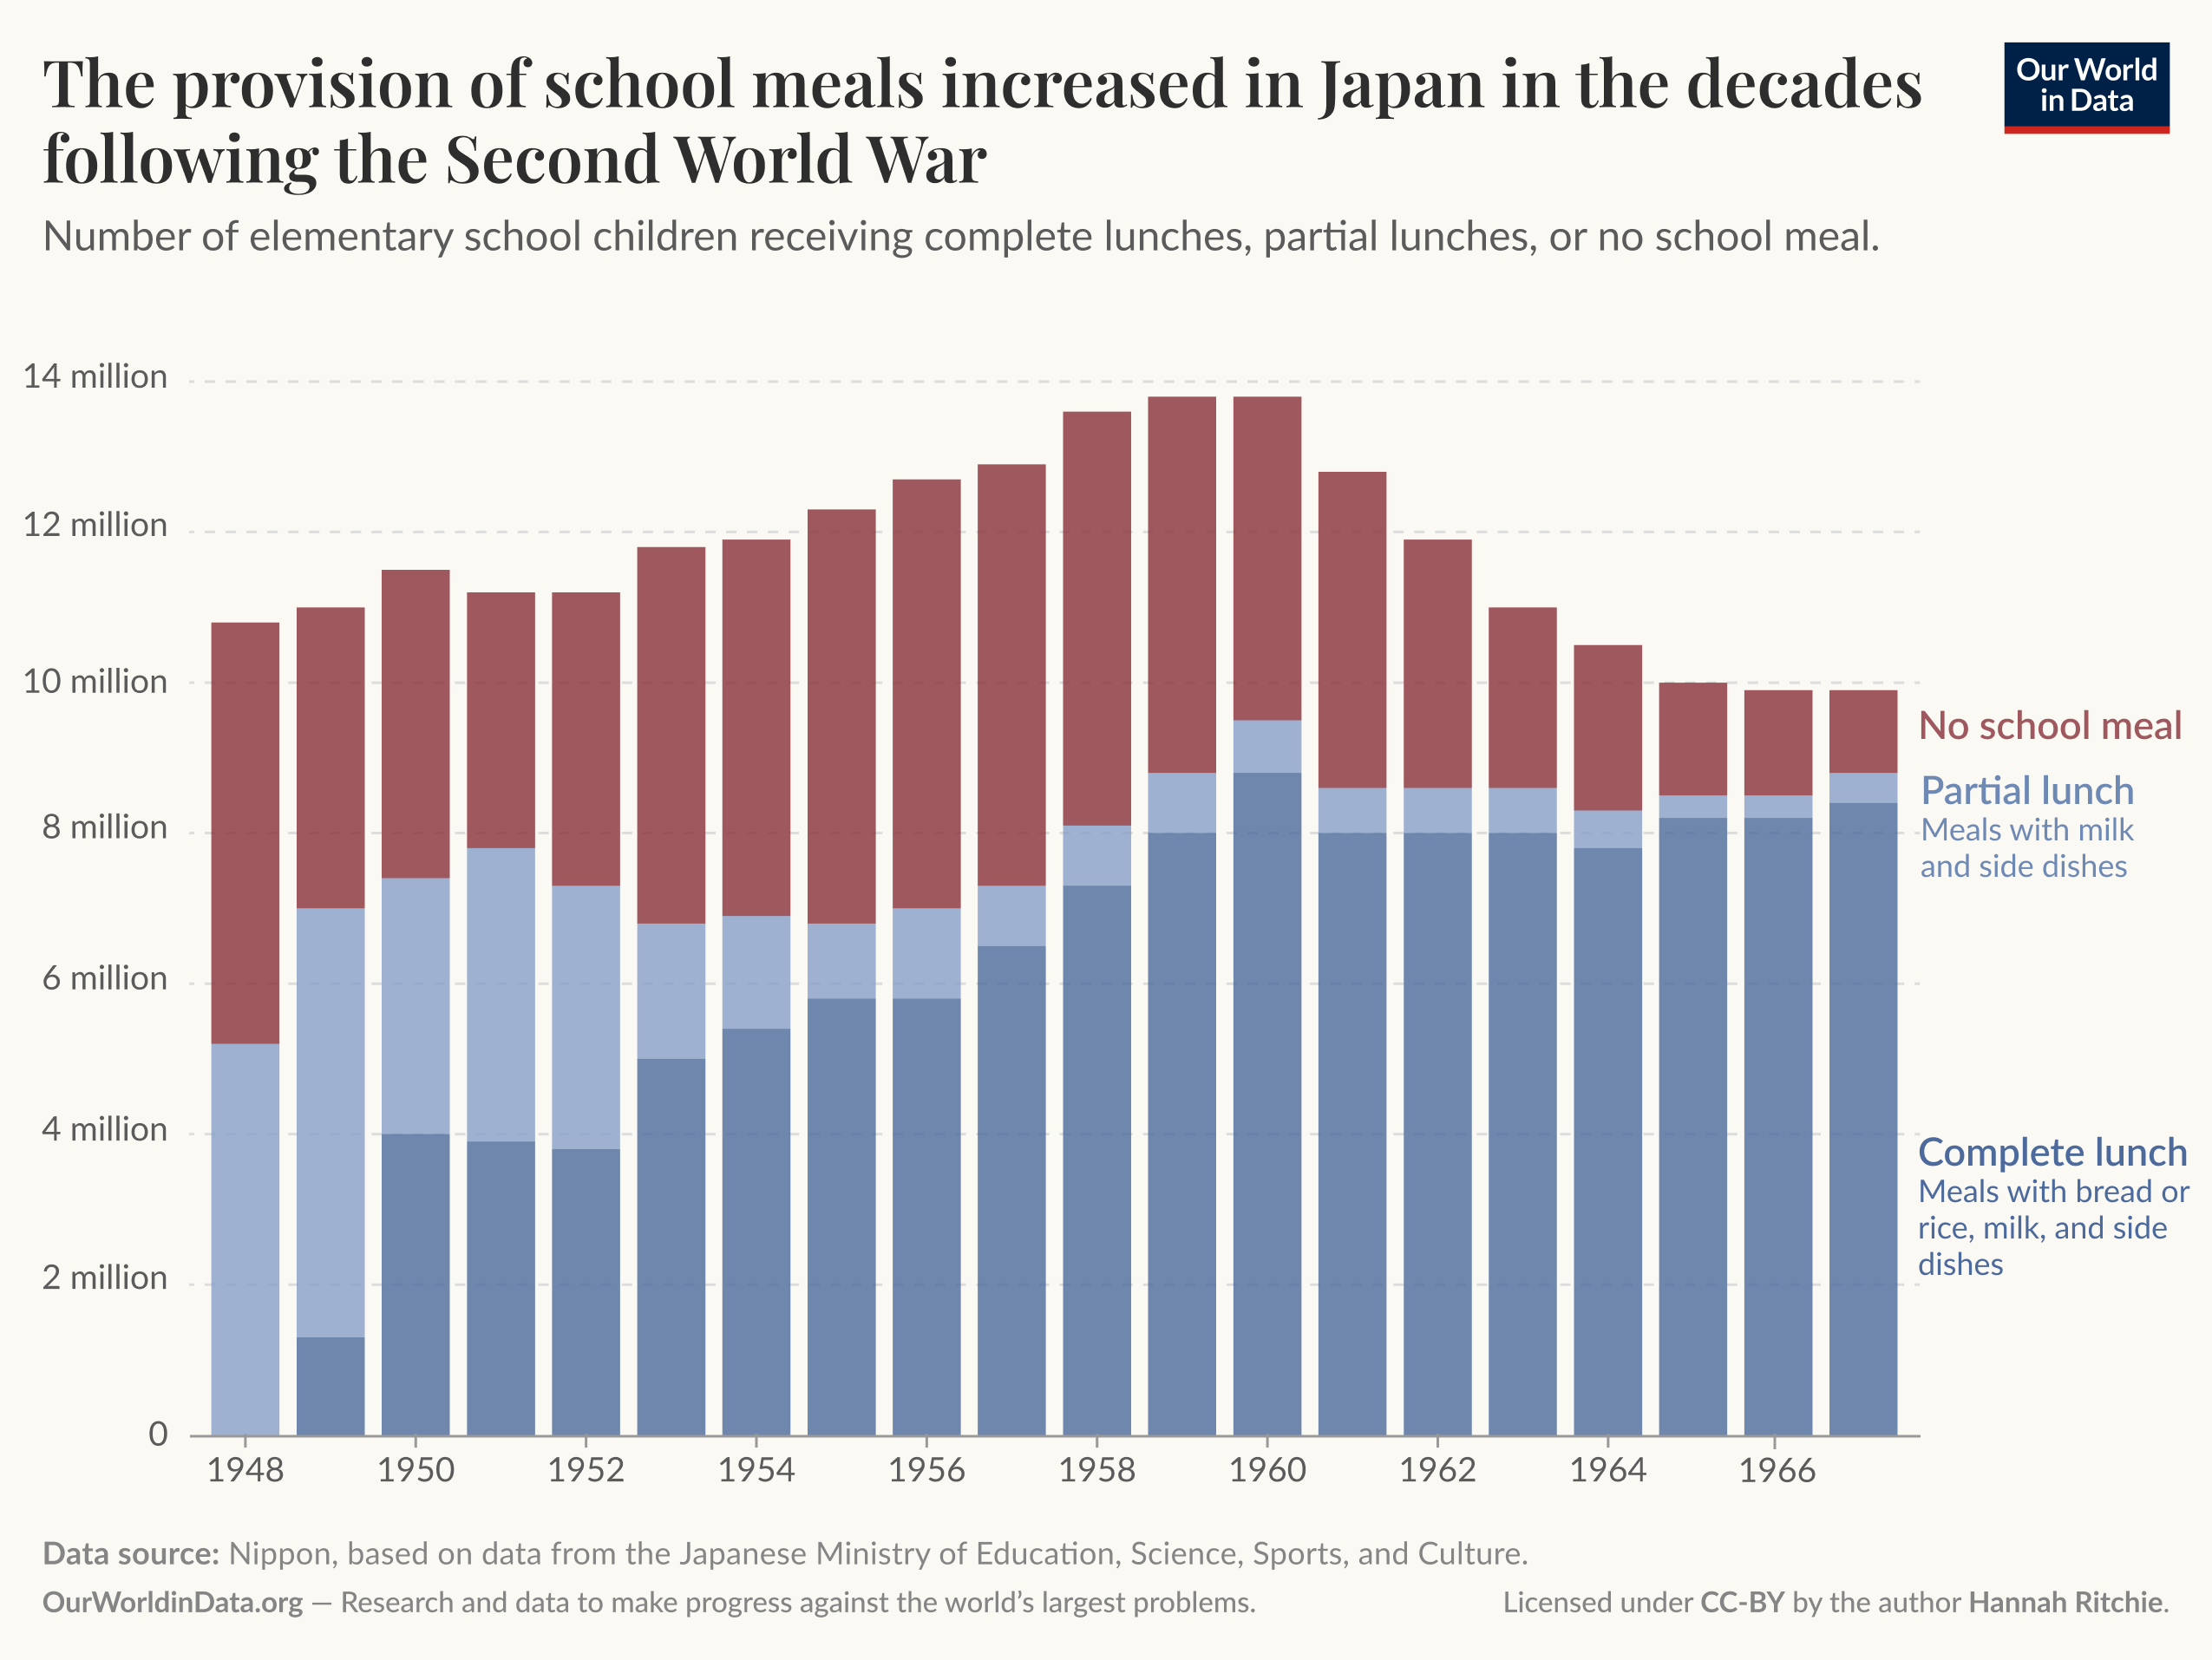
The Japanese government made childhood nutrition a priority. The post-war period marked a huge scale-up in school lunches.15 You can see this rollout in the chart below.
In 1948, half of school children were receiving partial lunches; that is, meals with milk and side dishes. By the 1960s, almost all children were receiving complete lunches, which were even more substantial.
Children’s nutrition dramatically improved, and so did their mothers’.
One reason why Japanese stunting rates were previously so high was because of maternal malnutrition. A malnourished mother greatly increases the risk of a baby being born underweight. Between 1900 and 1970, average birth weight in Japan increased by 250 grams.16
In a number of low-to-middle-income countries today, many babies are born with low birthweights. In countries such as India, it’s more than one-quarter. Improving maternal health is therefore essential to make sure that children are not at a disadvantage before they’re even born.
Japan’s progress on stunting was impressive. But it is not unique.
Some countries in recent decades have achieved declines as steep as Japan’s post-war transformation. In the chart below, you can see data for Ethiopia, Nepal, and Peru over the past few decades. These are often held up as modern exemplars of countries making rapid progress. What’s notable is that they span South America, Africa, and Asia.
While this new long-run dataset on stunting rates over the 20th century helps us understand that it is not inevitable, we should also be honest about the challenges in ending stunting everywhere.
Countries like Burundi and India are where Japan was decades ago. Japan’s experience shows that transformation is possible, but it requires simultaneous action on disease, diet, and infrastructure sustained over a generation. Nonetheless, that seems like an investment worth making. The future of hundreds of millions of children depends on it.
Acknowledgments
Many thanks to Eric Schneider and Juliana Echeverri for the provision of data and feedback on this article. We’d also like to thank Max Roser and Edouard Mathieu for comments and editorial feedback.
Continue reading on Our World in DataCite this work
Our articles and data visualizations rely on work from many different people and organizations. When citing this article, please also cite the underlying data sources. This article can be cited as:
Hannah Ritchie and Tuna Acisu (2026) – “Childhood stunting fell dramatically over the 20th century” Published online at OurWorldinData.org. Retrieved from: ‘https://archive.ourworldindata.org/20260511-000141/childhood-stunting-fell-dramatically-over-the-20th-century.html’ [Online Resource] (archived on May 11, 2026).
BibTeX citation
@article{owid-childhood-stunting-fell-dramatically-over-the-20th-century,
author = {Hannah Ritchie and Tuna Acisu},
title = {Childhood stunting fell dramatically over the 20th century},
journal = {Our World in Data},
year = {2026},
note = {https://archive.ourworldindata.org/20260511-000141/childhood-stunting-fell-dramatically-over-the-20th-century.html}
}![]() Reuse this work freely
Reuse this work freely
All visualizations, data, and code produced by Our World in Data are completely open access under the Creative Commons BY license. You have the permission to use, distribute, and reproduce these in any medium, provided the source and authors are credited.
The data produced by third parties and made available by Our World in Data is subject to the license terms from the original third-party authors. We will always indicate the original source of the data in our documentation, so you should always check the license of any such third-party data before use and redistribution.
All of our charts can be embedded in any site.