


Mice
Female BALB/cJRj mice (6–7 weeks old) were purchased from Janvier (France). Heterozygous BALB/c IFN-β reporter female mice (IFN-β+/Δβ-luc) (6–7 weeks old) were bred in-house, with the original breeding pairs obtained from the Institute for Laboratory Animal Science, Hannover Medical School (Germany)40. All the in vivo experiments were strictly reviewed and approved by the Ethics Committee of the Faculty of Veterinary Medicine, Ghent University (EC2023/026) and the VIB-UGent Institutional Ethical Committee on Experimental Animals (EC2025-035). All intramuscular injections were performed in the quadriceps muscle using 50 µl. Blood samples (maximal 50 µl) were collected from the tail vein under anaesthesia or via cardiac puncture for collecting blood for passive transfer. The mice were euthanized before cardiac puncture or spleen collection. Mice were housed in ventilated cages with high-efficiency particulate air filters and in temperature-controlled (22–24°) and humidity-controlled (40–60%), air-conditioned BSL1 or BSL2 facilities. Mice had access to food and water ad libitum. All animal experiments were conducted according to the Belgian legislation (Belgian Law 14/08/1986 and Belgium Royal Decree 06/04/2010) and European legislation on the protection of animals used for scientific purposes (EU directives 2010/63/EU and 86/609/EEC).
Synthesis and purification of saRNAs and mRNAs
An overview of the saRNAs and modified mRNAs that were designed and used in this work is shown in Supplementary Fig. 1. The 5’ UTR, the 3’ UTR, the non-structural proteins (nsP) 1-4, and the subgenomic promoter in all saRNAs were based on the Venezuelan Equine Encephalitis Virus (VEEV) TC-83 strain (GenBank: L01443.1). In the saRNAFluc, saRNAHA, saRNAHA-RG and saRNAmCherry, the subgenomic RNA encoded for respectively firefly luciferase (GenBank: ABA41662.1), hemagglutinin (HA) of A/Anhui/1/2005(H5N1)28 (GenBank: HM172104), hemagglutinin (HA) of A/Vietnam/1194/2004 (H5N1) (GeneBank: AY651333.1), and mCherry (GenBank: OQ335096.1). The subgenomic gene in the saRNARep construct was deleted, resulting in a replicon that retains only the nsP genes, 5′ UTR, subgenomic promoter, and 3′ UTR of VEEV TC-83 strain (GenBank: L01443.1). All saRNAs were designed, produced and validated within our team. Two non-replicating mRNAs encoding either firefly luciferase (GenBank: ABA41662.1) or the VEEV replicase (GenBank: L01443.1) were also designed and produced in our lab. For mRNAFluc and mRNARep, we used the 5’ UTR of human α−1-globin and the 3’ UTR of the Pfizer-BioNTech BNT162b2 COVID-19 vaccine (GenBank: OR134577.1). The mRNAmCherry was purchased from Trilink Biotechnologies (San Diego, USA, Cat # L-7203) and contains a CleanCap and the 5-methoxyuridine modification.
The saRNAs were synthesized through in vitro transcription (IVT) as previous described28. Briefly, the IVT template was synthesized by PCR using primers (Forward: CAGGGTAATTAATACGACTCACTATAATG Reverse: TTTTTTTTTTTTTTTTTTTTTTTTTTTTTTTTTTTTTTTTGAAATATTAAAAACAAAATCCGATTC), and confirmed by examining the template DNA through agarose gel electrophoresis. The template was purified using silica spin columns (PCR & DNA cleanup kit, T1030S, New England Biolabs). The purified templates were then employed in an IVT reaction (AM1334, Thermo fisher), with co-transcriptional capping using CleanCap technology (CleanCap AU N711410, Trilink BioTechnology, USA), following the manufacturer’s instructions. The IVT template for mRNA were also synthesized by PCR using primers (Forward: TAGGTAATACGACTCACTATA Reverse: GCCTTTTGCTCAATTACCCTG), and confirmed by examining the template DNA through agarose gel electrophoresis. The template was purified in the same manner as the saRNA template and employed in an IVT reaction with co-transcriptional capping (CleanCap AG N711310, Trilink) and 50% Pseudouridine (N1019-1, Trilink). The resulting saRNA and mRNA were purified using an RNA cleanup kit (T2050L, New England Biolabs) and subjected to cellulose-based purification to minimize the IFN response induced by dsRNA, as described elsewhere41. In brief, cellulose was prewashed with chromatography buffer (10 mM HEPES [pH 7.2], 0.1 mM EDTA, 125 mM NaCl, and 16% ethanol), and the saRNA or mRNA was added to the prewashed cellulose and incubated for 30 min with shaking. The ssRNA was collected by centrifugation with removal of dsRNA that bind to the cellulose. The mRNAs and saRNAs were precipitated using isopropanol, dissolved in RNase-free water, and stored at −80 °C for further use. HA expression of the saRNAHA vaccine was confirmed as previously described28 by denaturing gel electrophoresis and Western blotting. HA expression of the saRNAHA-RG was confirmed in Supplementary Fig. 7.
Lipid nanoparticle formulation and characterization
RNAs were formulated in lipid nanoparticles (LNPs) by rapid mixing three volumes of an aqueous solution containing the saRNA or mRNA (in sodium acetate, pH 4.5) with one volume of an ethanolic solution (100% ethanol) containing the ALC-0315 lipid (HY-138170, MedChemExpress, USA), DMG-PEG2K (880151 P, Avanti Polar Lipids, USA), cholesterol (700100 P, Avanti Polar Lipids) and DOPE (850725 P, Avanti Polar Lipids) at a molar ratio of 50: 1.5: 38.5: 10. After formulation, the saRNA-LNPs or mRNA-LNPs were dialyzed using a dialysis cassette (66003, Thermo Fisher) against DPBS (14190144, Thermo Fisher) to remove the ethanol. Size and zeta potential was determined by dynamic light scattering in 20 mM HEPES buffer. The average sizes were between 100 nm to 170 nm and zeta potentials of the saRNA-LNPs were between −5mV to 2 mV and encapsulation efficacy was always >90%.
Animal experimentsAnti-replicase immunity and saRNA expression
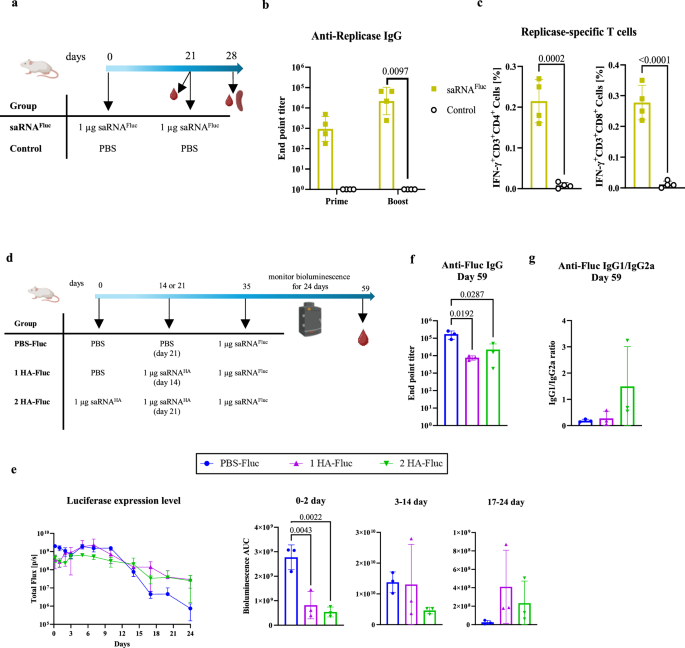
To evaluate whether the saRNA vaccine platform results in anti-replicase immunity, mice received two intramuscular injections of 1 µg saRNAFluc-LNPs 3 weeks apart. Blood samples were collected from the tail vein 3 weeks after the first injection and one week after the second injection to determine anti-replicase antibodies by ELISA. Spleens were harvested 1 week after the second injection to quantify the anti-replicase CD4+ IFN-γ+ and CD8+ IFN-γ+ T cells in splenocytes using intracellular staining and flow cytometry.
Effect of pre-existing replicase immunity generated by a first saRNA exposure on the immunogenicity of a subsequent influenza saRNA vaccine
To investigate whether a first saRNA vaccination schedule could affect the immune responses of a subsequent saRNA vaccination schedule, mice received first two intramuscular injections of 1 µg saRNAFluc-LNPs or PBS with 3 weeks apart. Subsequently, after 2, 4 or 8 weeks mice were vaccinated with 1 µg saRNAHA-LNPs using a prime-boost schedule with a 3-week interval. Blood samples and spleens were isolated at several time points to study the effect of pre-existing replicase immunity on the anti-HA immune responses. The experimental setup and timelines are shown in Fig. 2a.
Inducing pre-existing anti-replicase immunity with other saRNAs and mRNAs
To elucidate how the source and type of pre-existing anti-replicase immunity affects subsequent saRNA vaccination, BALB/cJRj mice were pretreated with two intramuscular injections, given 3 weeks apart, of either 1 µg saRNAFluc-LNPs, saRNARep-LNPs, mRNAFluc-LNPs or mRNARep-LNPs (Supplementary Fig. 1). A similar experiment was performed in BALB/c IFN-β reporter mice, which were pretreated with 1 µg saRNAmCherry-LNPs, mRNAmCherry-LNPs or mRNARep-LNPs. The IFN-β reporter mice allowed us to monitor whether the pretreatments affected the innate immunity of the subsequent saRNAHA-LNP vaccines. Two weeks after the pretreatment the mice were vaccinated with 1 µg saRNAHA-LNPs using a prime-boost schedule with a 3-week interval. Blood samples and spleens were isolated at several time points to study the effect of pre-existing anti-replicase immunity on the anti-HA immune responses. The experimental setup and timeline are shown in Fig. 3a and Supplementary Fig. 4a.
Passive transfer of anti-replicase serum and splenocytes
To elucidate how pre-existing anti-replicase antibodies or T cells affect saRNA vaccine efficacy, passive transfer experiments were performed with either 350 µl PBS, 350 µl anti-replicase serum, 1.4 × 10⁶ T cells or 350 µl anti-replicase serum plus 1.4 × 10⁶ T cells from mice having anti-replicase immunity. Spleens were homogenized using a syringe plunger, and the red blood cells were lysed with ACK lysing buffer (A1049201, Thermo Fisher). Splenocytes were diluted to 2 × 10⁶/ml in RPM-1640 medium with 10% FBS and stimulated with the nsP peptide mix overnight (final concentration 1 µg/ml of each peptide). The next day, T cells were separated by EasySep™ Mouse T Cell Isolation Kit (19851, Stemcell technologies). The passive transfer of serum and T cells was performed via intravenous injection through the tail vein. Successful passive transfer of T cells was confirmed by labeling the T cells with CellTrace™ Far Red Cell Proliferation Kit (C34572, Thermo Fisher Scientific). Subsequently, 1.4 × 10⁶ labeled T cells in 350 µL PBS were injected intravenously into naive mice. Three days post-transfer, recipient mice were euthanized, and the spleen and lymph nodes were isolated to generate single-cell suspensions. These were stained with eBioscience™ Fixable Viability Dye eFluor™ 506 (65-0866-14, Invitrogen) for 30 min at room temperature. Following a washing step, Fc receptors were blocked with Rat anti-mouse CD16/CD32 antibody (553142, BD Biosciences) for 15 min. Cells were then stained with Alexa Fluor® 488-conjugated anti-mouse CD3 antibody (clone 17A2, lot B354286, 100210, BioLegend) and analyzed by flow cytometry. To confirm successful serum transfer, blood samples were taken one day after the serum transfer and the levels of anti-replicase antibodies was measured by ELISA. One day after the transfers, mice were vaccinated with two injections of 1 µg saRNAHA-LNPs given 3 weeks apart. Before the first vaccination, blood samples were collected to measure the passively transferred anti-replicase antibodies. Blood and spleen samples were harvested 1 week after the last saRNAHA-LNP vaccination to readout antibody titers and cellular immune response. A control group that received only PBS at each time point was also included. The experimental setup and timelines are shown in Fig. 4a.
In vivo bioluminescence imaging
Luciferase expression kinetics was measured on several time points after intramuscular injection of saRNAFluc-LNPs. To that end, mice received a subcutaneous injection of 200 µl D-luciferin (15 mg/ml) and 10 min later in vivo bioluminescence was measured using a Lumina III In Vivo Imaging System (IVIS, Revvity PerkinElmer, USA).
Antibody titers
Serum was obtained from blood samples after clotting and centrifugation. HA-specific, replicase-specific or luciferase-specific antibody levels were determined in the sera using an ELISA assay. In brief, Nunc MaxiSorp plates (44-2404-21, Thermo fisher) were coated overnight at 4 °C with one of the following: 25 ng/well A/Anhui/1/2005 Hemagglutinin HA Protein (11048-V08B, Sino Biological, China) for anti-HA antibodies, 100 ng/well Recombinant Venezuelan equine encephalitis virus Polyprotein P1234 (CSB-EP329710VAZ, Cusabio, USA) for anti-replicase antibodies, or 1 µg/well luciferase (E1702, Promega, USA) for anti-luciferase antibodies. The plates were then washed three times with washing buffer (PBS with 0.05% tween-20) and blocked with assay buffer (DS98200, Thermo fisher) for 1 h at room temperature. After washing, serially diluted mouse sera were added to the plates and incubated at room temperature for 2 h. Subsequently, the plates were washed three time, and were incubated with a HRP-conjugated anti mouse IgG (H+L) (1:10,000 dilution, 31430, Invitrogen) for 1 h at room temperature. The plates were then washed 4–5 times. Next, 100 μL of TMB solution (10445723, Invitrogen) was added to each well. After 15 min incubation, 100 μL of stop solution was added. Absorbance at 450 nm was measured using a Cytation 5 (Agilent Technologies, Santa Clara, USA). Antibody levels were calculated as endpoint titers, defined as the highest dilution of serum that produced an absorbance value above the cut-off. The cut-off was determined as the mean of the control wells plus three times the standard deviation.
Cellular immune responses
Spleens were harvested from the mice 1 week after the first or second saRNA-LNP injection. Subsequently, spleens were homogenized using a syringe plunger, and the red blood cells were lysed with ACK lysing buffer (A1049201, Thermo Fisher). A total of 106 splenocytes were stimulated for 16 h with PepMix™ Influenza A (HA/Indonesia (H5N1) (PM-INFA-HAIndo, JPT Peptide Technologies GmbH, Germany) or a customized replicase-targeting peptides mix (Table S1) synthesized by JPT Peptide Technologies GmbH, or with a cell stimulation cocktail as a positive control (00-4970, Invitrogen). Cytokine secretion was inhibited by adding a mixture of Monensin Solution (00-4505-51, Thermo Fisher) and eBioscience™ Brefeldin A Solution (00-4506-51, Thermo Fisher). Next, the splenocytes were incubated with eBioscience Fixable Viability dye eFluor 506 (lot 2696732, 65-0866-14, Invitrogen) for 30 min. Then, after washing, the Fc receptors were blocked with Rat anti-mouse CD16/CD32 (553142, BD Biosciences, USA) for 15 min. The splenocytes were then incubated with Alexa Fluor® 488 anti-mouse CD3 antibody (clone 17A2, lot B354286, 100210, Biolegend, USA), PerCP/Cyanine5.5 anti-mouse CD4 Antibody (clone RM4-4, lot B374471, 116011, Biolegend), Alexa Fluor® 700 anti-mouse CD8a Antibody (clone 53-6.7, lot B386942, 100729, Biolegend) for 30 min. After fixation and permeabilization using eBioscience™ Intracellular Fixation & Permeabilization Buffer Set (88-8824-00, Invitrogen), the splenocytes were stained with PE anti-mouse IFN-γ Antibody (lone W18272D, lot B358874, 163503, Biolegend). The fluorophores were then measured using a CytoFLEX flow cytometer (Beckman Coulter, USA). Flow cytometry data were analysed using FlowJo v10. The gating strategy is shown in Supplementary Fig. 10.
Hemagglutination inhibition titers
To determine the levels of protective anti-HA antibodies in the collected serum samples, an HI assay was performed as previously described42. HA titration of the H5N1 virus particle (07/290, NIBSC, UK) was first performed using a 0.75% turkey blood cell suspension to quantify the virus particles needed for the hemagglutination inhibitor assay. Subsequently, 10 µL of mouse serum was mixed with 30 µL cholera filtrate (c8772, sigma) and incubated overnight at 37 °C. The mixture was then incubated at 56 °C for 30 min to inactivate cholera filtrate. Each well of a 96 V-bottom plate was filled with 25 µL PBS. The first wells of each row received 25 µL of serum mixture, followed by 2-fold serial dilutions across the plate, with 25 µL discarded from the final wells. The lowest dilution factor of the serum was 8. Next, 25 µL of the inactivated strain matched H5N1 virus, containing 4 HA units, was added to each well. The plate was gently tapped and incubated for 30 min at room temperature. Finally, 50 µL of 0.75% turkey blood cell suspension was added to each well and incubate for 30 min. The plate was then tilted vertically for 25 s before reading out. After obtaining the results, HI titers were subsequently analyzed using GraphPad Prism (version 10.1.10), and the “geometric mean with geometric SD” was selected for the analysis.
Challenge experiment
The H5N1 influenza A virus NIBRG-14 was obtained from the UK National Institute for Biological Standards and Control. NIBRG-14 is a reassortant generated by reverse genetics (RG) from A/Vietnam/1194/2004 (H5N1) virus, in which the polybasic HA cleavage site has been excised, and A/PR/8/34 (H1N1) virus. In contrast to A/Anhui/1/2005(H5N1), NIBRG-14 causes lethal infections in mice43. Specific-pathogen-free female BALB/c mice (6 weeks old) were purchased from Janvier (France) and pre-exposed to saRNAFluc-LNPs to induce anti-replicase immunity. Subsequently, these mice were vaccinated with saRNAHA-RG-LNPs as summarized in Fig. 6a. A non-pretreated and non-vaccinated control group received only PBS. Two weeks after the final saRNAHA-RG vaccination or PBS injection, mice were challenged intranasally with 5 LD50 of NIBRG-14 diluted in 50 μl PBS. This volume was equally divided over both nostrils. HI titers were determined using blood collected from a tail vein 2 weeks after the final saRNAHA-RG vaccine (just before challenge). The humane endpoint for euthanasia was defined as ≥25% body weight loss relative to the day of challenge. To determine the HI titers in these mice a slightly different HI assay was used. Briefly, 10 µL serum was mixed with 40 µL of receptor-destroying enzyme (RDE) and incubated overnight at 4 °C. The next day, 50 µL of 1.5% sodium citrate was added to the mixture. Then, the mixture was heat-inactivated at 56 °C for 30 min to inactivate residual RDE activity. For the HI assay, 25 µL of the treated serum was mixed with 25 µL PBS in the first well, resulting in a starting serum dilution of 1:20. The rest of the procedure was similar to the HI assay described above.
Data collection and analysis
CytExpert 2.5 (Beckman Coulter) was used for collecting the flow cytometry data. Image Lab 6.1 (Bio-Rad) was applied for collecting Western blot data. Gen5 3.12 (Agilent) was used to read out the ELISA results. The living image 4.7.2 (64-bit) (Revvity) software was applied for reading out and analysing in vivo bioluminescence data. Flowjo 10.8.1 was used to analyse the flow cytometry data.
Statistical analysis
Statistical analyses were performed using GraphPad Prism (version 10.1.10). Effect size Cohen’s d was computed as the difference in group means divided by the pooled SD. The antibody endpoint titers were represented as geometric means and other data were represented as arithmetic means. Error bars represent the standard deviation (SD). Detailed information on the statistical analyses can be found in the figure legends. All samples were obtained from distinct sources unless otherwise stated.
Reporting summary
Further information on research design is available in the Nature Portfolio Reporting Summary linked to this article.