


Riken Vitamin (TSE:4526) has wrapped up FY 2026 with fourth quarter revenue of ¥23,797 million and basic EPS of ¥37.13, capping a year in which trailing twelve month revenue came in at ¥96,300 million and basic EPS at ¥238.17. Over the past six reported quarters, revenue has ranged between ¥22,730 million and ¥25,703 million per quarter while basic EPS has moved between ¥37.13 and ¥118.33, giving investors a clear view of how top line scale and per share profitability have tracked together into the latest print. With trailing net margin at 7.3% compared with 9.8% a year earlier and a sizeable ¥2.5 billion one off gain in the mix, the focus now turns to how sustainably Riken Vitamin can defend and rebuild its underlying margins.
See our full analysis for Riken Vitamin.
With the headline numbers on the table, the next step is to set these results against the most widely held narratives about Riken Vitamin to see which stories the margins support and which ones the latest data starts to challenge.
Curious how numbers become stories that shape markets? Explore Community Narratives
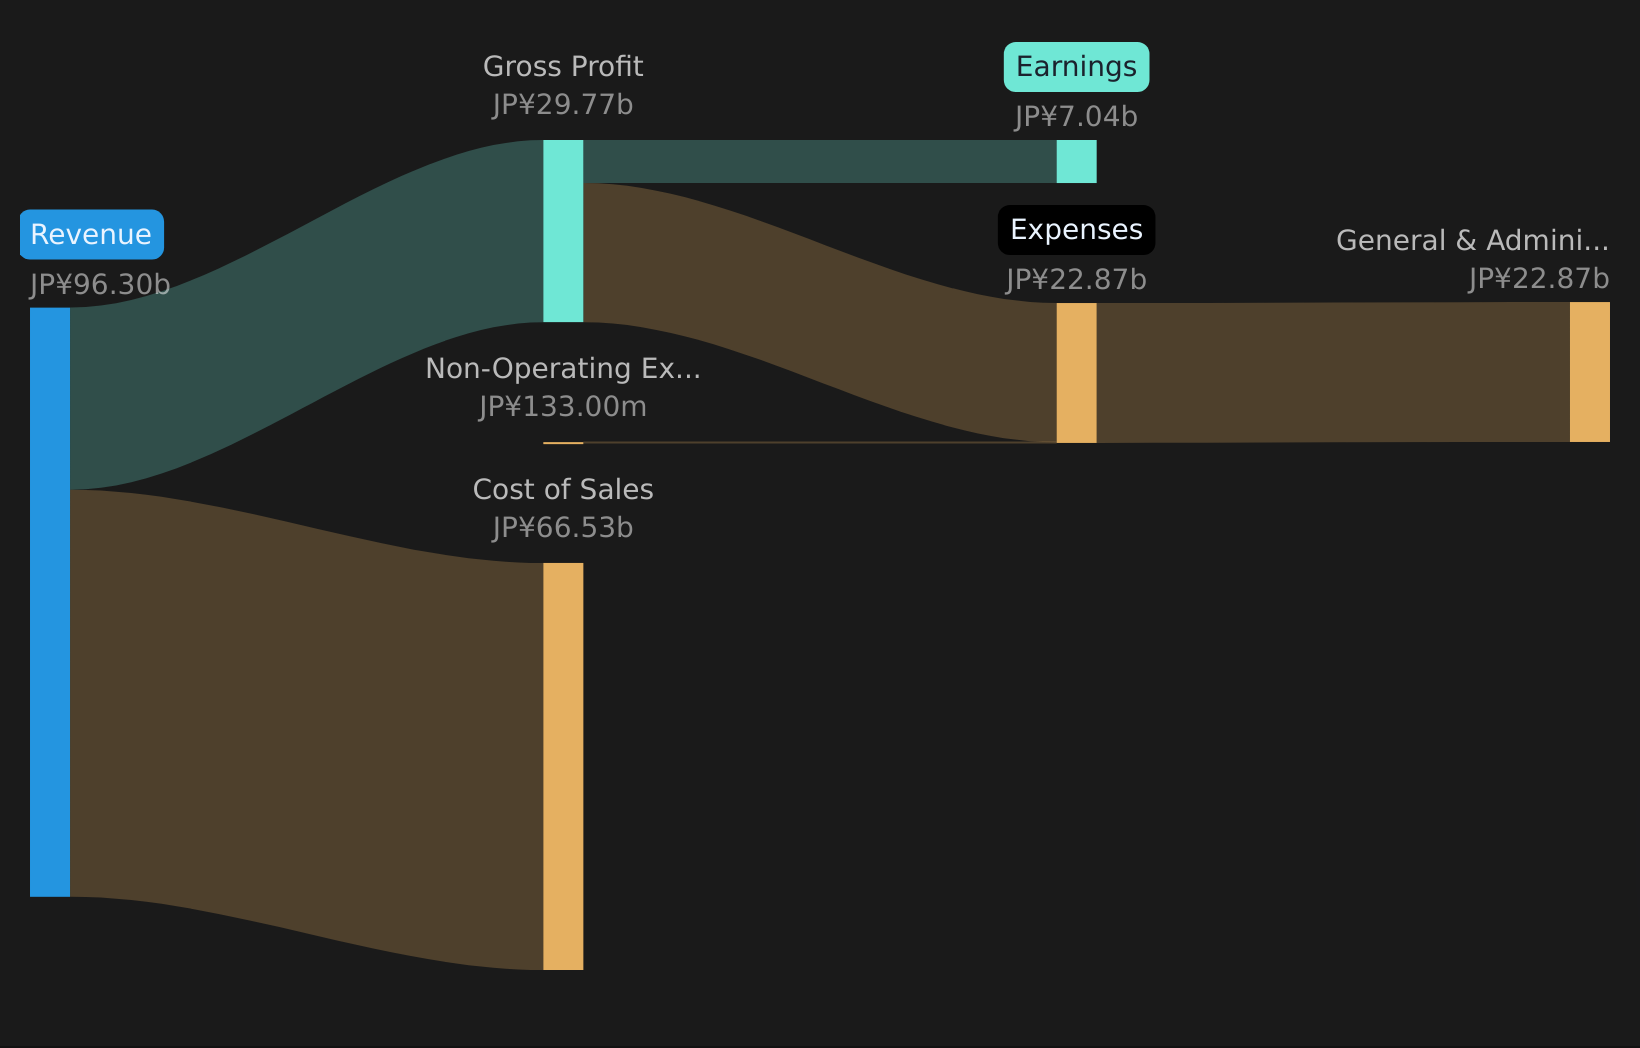 TSE:4526 Revenue & Expenses Breakdown as at May 2026 Margins Under Pressure At 7.3% Trailing net margin sits at 7.3%, compared with 9.8% a year earlier, and the last 12 months include a sizeable ¥2.5b one off gain that lifts reported profit above what the core business alone would have produced. Critics highlight a bearish worry that profitability is slipping, and the numbers give that view some backing:
Net income over the latest trailing twelve months is ¥7,035 million on revenue of ¥96,300 million, while the margin reference of 9.8% from a year earlier points to stronger profitability at that time. With earnings also expected to decline on average by about 5.3% per year over the next three years, the lower 7.3% margin today sits on top of forecasts that already assume weaker profit power. EPS Volatility And One Off Support Quarterly basic EPS over the last six reported quarters has moved between ¥37.13 and ¥118.33, while trailing twelve month basic EPS has shifted between ¥238.17 and ¥319.59, showing that per share results have been quite sensitive to quarter to quarter swings and one off items. Bears argue that the recent EPS record is flattered by non repeating gains, and the data supports that caution:
A ¥2.5b one off gain is explicitly included in the last 12 months, which, when set against trailing net income of ¥7,035 million, represents a material share of reported profit. At the same time, analysts expect earnings to decline by about 5.3% per year over the next three years, so a material one time boost on top of an earnings decline outlook makes it harder to treat the recent EPS level as a steady baseline. On this kind of mixed profitability picture, many investors like to see how others frame the stock’s longer term story before making up their minds, which is where community driven narratives can be helpful. Curious how numbers become stories that shape markets? Explore Community Narratives. P/E Of 11.7x Versus Sector The stock trades on a trailing P/E of 11.7x, compared with 15.2x for the broader JP Food industry and 14.3x for the overall JP market, while peers sit at an average of about 11.6x, so the valuation is slightly below market and industry but close to direct competitors. What is interesting for a more optimistic angle is how this valuation lines up against the risk and income profile:
The dividend yield is 3.89% even though free cash flow coverage is described as weak, so investors are being offered income at a time when the market is pricing the stock at a discount to the wider sector on P/E. Revenue growth is described as modest at about 0.6% per year and below the 5.9% rate expected for the JP market, which means supporters of a bullish case would need to be comfortable with slower growth in exchange for a lower multiple and current income. Next Steps
Don’t just look at this quarter; the real story is in the long-term trend. We’ve done an in-depth analysis on Riken Vitamin’s growth and its valuation to see if today’s price is a bargain. Add the company to your watchlist or portfolio now so you don’t miss the next big move.
If this mix of pressure on margins and pockets of support leaves you on the fence, take a close look at the data yourself and decide how it fits your risk tolerance. To balance the concerns investors have flagged with the upside they still see, it is worth weighing 1 key reward and 3 important warning signs.
See What Else Is Out There
Riken Vitamin is currently dealing with margin pressure, volatile EPS supported by a sizeable one off gain, modest revenue growth, and a dividend that rests on weak free cash flow coverage.
If that mix of softer profitability and income quality worries you, compare it with companies screened for stronger cash coverage and financial resilience using the solid balance sheet and fundamentals stocks screener (36 results).
This article by Simply Wall St is general in nature. We provide commentary based on historical data
and analyst forecasts only using an unbiased methodology and our articles are not intended to be financial advice. It does not constitute a recommendation to buy or sell any stock, and does not take account of your objectives, or your
financial situation. We aim to bring you long-term focused analysis driven by fundamental data.
Note that our analysis may not factor in the latest price-sensitive company announcements or qualitative material.
Simply Wall St has no position in any stocks mentioned.
New: AI Stock Screener & Alerts
Our new AI Stock Screener scans the market every day to uncover opportunities.
• Dividend Powerhouses (3%+ Yield)
• Undervalued Small Caps with Insider Buying
• High growth Tech and AI Companies
Or build your own from over 50 metrics.
Have feedback on this article? Concerned about the content? Get in touch with us directly. Alternatively, email editorial-team@simplywallst.com