Model architecture, training and validation
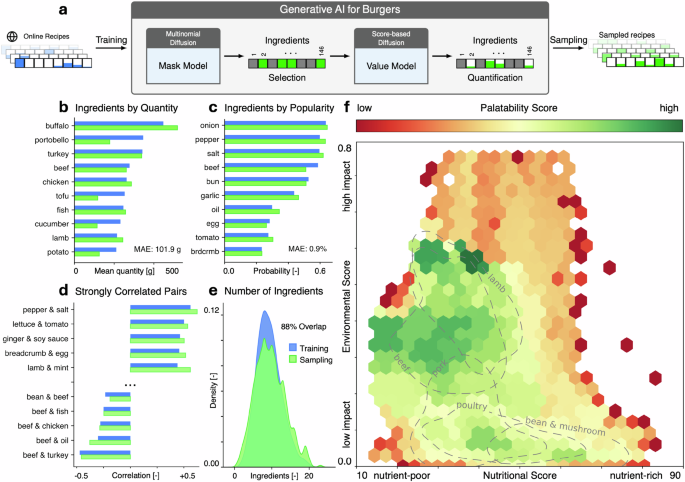
Food recipes are hybrid discrete–continuous objects that require ingredient selection and ingredient quantification. Here we represent each burger recipe solely by its ingredients and their associated weights. Accordingly, a recipe x0 = {m, w}, consists of a binary ingredient mask m ∈ {0, 1}K that indicates presence or absence of each ingredient and the ingredient weight \({\bf{w}}\in {{\mathbb{R}}}^{K}\). We adopt a two-stage diffusion-based framework that decouples ingredient selection from ingredient quantification: Specifically, we integrate a multinomial diffusion model41 to generate ingredient masks with a score-based generative model42 to generate ingredient weights conditional on a given mask (Fig. 1a, Supplementary Material S.1.2).
Diffusion-based recipe generation
Conceptually, diffusion models learn burger design by progressively randomizing existing recipes into noisy ingredient combinations and then learning how to reverse this process to reconstruct realistic burgers22. Once trained, the model starts from random noise and iteratively samples plausible ingredient combinations and quantities that resemble human-designed recipes. Formally, diffusion models define a forward stochastic process q(xt∣xt−1) that gradually adds noise to data samples x0 to produce latent variables xt that increasingly obscure the original data throughout t = 1, . . . , T time steps43. The learnable component is the reverse stochastic process p(xt−1∣xt), which progressively removes noise and enables generation from an unstructured prior. We train the diffusion model by maximizing a variational lower bound on the data likelihood, which corresponds to the evidence lower bound,
$$\log\,{\rm{P}}({{\bf{x}}}_{0}) \ge {{\mathbb{E}}}_{{{\bf{x}}}_{1},\cdots,{{\bf{x}}}_{T} \sim q}\left[\log p({{\bf{x}}}_{T})+\mathop{\sum }\limits_{t=1}^{T}\log \frac{p({{\bf{x}}}_{t-1}| {{\bf{x}}}_{t})}{q({{\bf{x}}}_{t}| {{\bf{x}}}_{t-1})}\right].$$
Here P(x0) denotes the marginal likelihood of an observed burger recipe under the generative model, obtained by integrating over all latent diffusion variables, where x0 is a human-designed burger recipe, xt is its progressively noised representation, q is the fixed forward process, p is the learned reverse denoising process, and \({\mathbb{E}}\) is the expectation operator that denotes an average over noise realizations drawn from the forward diffusion process.
Ingredient selection via multinomial diffusion
We model ingredient selection using a multinomial diffusion process in which ingredient presence is treated as a categorical variable. We define the forward process as
$$q({{\bf{x}}}_{t}| {{\bf{x}}}_{t-1})={\mathcal{C}}\left({{\bf{x}}}_{t}| (1-{\beta }_{t}){{\bf{x}}}_{t-1}+{\beta }_{t}/K\right),$$
where \({\mathcal{C}}\) denotes a categorical distribution with the parameter listed after the vertical bar ∣, βt controls the noise level at time step t, and K is the number of categories. In our application, ingredient selection is binary, K = 2, meaning an ingredient is either present or absent. The above equation reduces to a Bernoulli distribution with parameter (1 − βt)xt−1 + βt(1 − xt−1), which flips ingredient inclusion from present to absent or vice versa with a probability βt and keeps it the same with a probability (1 − βt). As t increases, the ingredient mask becomes progressively randomized, while the learned reverse process reconstructs statistically plausible ingredient combinations, which inherently capture dependencies between ingredients that commonly co-occur in burger recipes.
Ingredient quantification via score-based diffusion
Conditional on a given ingredient mask, we generate ingredient quantities using a score-based generative model formulated through stochastic differential equations. The forward noising process is
$${\rm{d}}{{\bf{x}}}_{t}\,=\,f({{\bf{x}}}_{t},\,t)\,{{\rm{d}}t}\,+\,{g}(t)\,{{{\rm{d}}B}_{t}},$$
and the reverse-time denoising process is
$${\rm{d}}{{\bf{x}}}_{t}=\left[{g}^{2}(t){\nabla }_{{\bf{x}}}\log {p}_{t}({\bf{x}})-f({{\bf{x}}}_{t},t)\right]{\rm{d}}t+g(t)\,{\rm{d}}{\tilde{B}}_{t},$$
where Bt is a K-dimensional Brownian motion, \({\tilde{B}}_{t}\) is its time reversal, and f and g define the drift and diffusion coefficients42,44. Here, rather than learning the probability density pt(x) directly, we approximate the score function \({\nabla }_{{\bf{x}}}\log {p}_{t}({\bf{x}})\) using a neural network to enable efficient sampling of ingredient weights consistent with observed distributions in human-designed burger recipes.
Dataset and training
We train our model on a curated burger dataset derived from an open-source collection of over half a million human-designed recipes from Food.com45,46. We filter all recipes for burgers, extract ingredients, quantities, and units from free texts, and standardize and convert the data into a structured representation. The final dataset consists of 2,216 burger recipes made up of 146 ingredients (Suppl. Material S.1.1, Suppl. Tables 1 and 2).
Model validation and statistical fidelity
The trained model accurately reproduces both first-order and higher-order statistical properties of the training data: The ingredient selection model estimates the marginal probability of each ingredient appearing in a random burger recipe with a maximum absolute error below 1% (Fig. 1b). The ingredient quantification model predicts quantities in previously unseen recipes with a mean absolute error of 101.9 g (Fig. 1c), despite the extrapolatory and highly stochastic nature of the problem. Beyond marginal statistics, the model captures higher-order structure, including pairwise ingredient correlations (Fig. 1d) and number of ingredients per recipe (Fig. 1b, e). These properties are not explicitly enforced during training, but emerge from the learned generative process (Suppl. Material S.1.3, Suppl. Figs. 1 and 2).
Substantial difference score to quantify similarity
Quantifying the proximity between recipes and grouping similar recipes is useful for various applications, for example, to quantify the novelty of an AI-generated recipe. For this purpose, we define the semi-discrete substantial difference score between two recipes r1 and r2,
$${\text{SDS}}({r}_{1},{r}_{2})=\mathop{\sum }\limits_{i=1}^{{n}_{{\rm{ing}}}}{d}_{i}({r}_{1},{r}_{2}),$$
as the sum of the binary distance di over all ning = 146 ingredients in the database, with
$${d}_{i}({r}_{1},{r}_{2})=\left\{\begin{array}{ll}1\quad\,{\text{if}}\,\,{r}_{1i}+{r}_{2i}\ne 0\,\text{and}\,{r}_{1i}\cdot {r}_{2i}=0\\ 1\quad\,{\text{if}}\,\,\max ({r}_{1i},{r}_{2i})/\min ({r}_{1i},{r}_{2i})\ge 2\\ 0\quad\,{\text{otherwise}}\,.\end{array}\right.$$
During rediscovery, we use the substantial difference score of zero, SDS = 0, to quantify a match between an AI-generated and a human-designed recipe. During discovery, we use values larger than zero, SDS > 0, to quantify the novelty of an AI-generated recipe compared to the human-designed recipes in the training set (Suppl. Material S.1.5).
Popularity score to quantify palatability
Palatability refers to qualities that make a food item desirable to the human palate, such as flavor, aroma, and texture. While the human palate displays significant variations across individuals, we can still quantify the overall palatability of a food product by measuring its popularity score within the population. This even extends to patterns in food preparation, as evidenced by the popularity of some combinations of ingredients compared to others (Fig. 1d). Here we propose to use popularity as a proxy for palatability. Our AI model learns the probability distribution of the human palate and assigns higher probabilities to popular recipes, patterns, and combinations. At the recipe level, more frequent repetitions effectively translate into a more palatable recipe associated with a higher popularity score.
Generative AI for burgers
We use the trained and validated model to rediscover the classic Big Mac® and discover five new delicious, sustainable, and delicious burgers (Fig. 5).
Fig. 5: Generative AI for Burgers.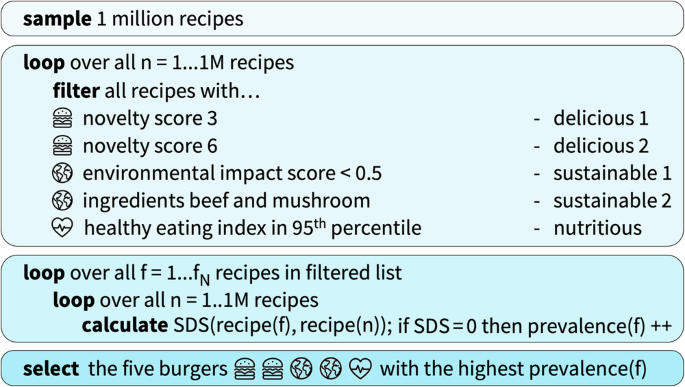
Algorithmic workflow for selecting the five AI-generated burgers used in the sensory survey. We first sample one million burger recipes from the trained diffusion model and filter recipes for deliciousness, sustainability, and nutrition. For each filtered subset, we compute the substantial difference score (SDS) relative to all one million recipes and quantify recipe prevalence through the number of SDS = 0 matches. We then select the burgers with the highest prevalence within each design category under the hypothesis that the most prevalent recipes are the most palatable.
The Classic burger
As a proof of concept, we use the generative model to rediscover the Big Mac®, one of the most widely consumed burgers worldwide27, served in more than 100 countries28. This global adoption reflects a high degree of palatability across diverse populations and makes the Big Mac® a stringent benchmark for evaluating whether the model captures widely shared preferences. Because the official recipe is proprietary, we approximate it by synthesizing four independent open-source recreations into a unified reference recipe47,48,49,50 (Fig. 1b, Suppl. Figs. 3 and 11). We then search for this reference recipe in randomly generated samples from the model (Fig. 1e). We define rediscovery as a sample with a substantial difference score of zero, SDS = 0, relative to the reference recipe. The training dataset did not contain the reference Big Mac® recipe (Supplementary Material S.1.4).
The delicious burger
Next, we use our artificial intelligence to discover delicious burgers, with a pre-defined novelty score. Specifically, we adopt the substantial difference score to quantify the novelty of an AI-generated sample by comparing it to the human-designed recipes in the training set (Suppl. Material S.1.5). For the Delicious Burger 1, we draw 1 million samples, filter all samples with SDS ≥ 3, and select the most repeated sample in the this list as the most palatable recipe with the highest popularity score (Fig. 2c, f, Supplementary Fig. 12). For the Delicious Burger 2, we perform the same steps, but now with SDS ≥ 6 (Fig. 2d, g, Suppl. Fig. 13).
The sustainable burger
We characterize environmental sustainability using life cycle assessment data, which estimate the total environmental impact of agricultural products across production and distribution chains based on global producer surveys51. We obtain ingredient-level data from a harmonized environmental database across n = 570 studies36. Since this database does not include mushrooms, we supplement it with land-use data from the United States Department of Agriculture52 and freshwater eutrophication potential, scarcity-weighted water use, and greenhouse gas emissions from European mushroom production53. We quantify sustainability using a single environmental impact score that averages normalized land use, aquatic eutrophication potential, scarcity-weighted water use, and greenhouse gas emissions across ingredients, weighted by their quantities30 (Suppl. Material S.1.6, Suppl. Table 3, Suppl. Figs. 4 and 5). For the Sustainable Burger 1, a plain mushroom burger with an environmental impact sore of 0.06, we draw 1 million samples, sort them by their environmental impact score, and select the most repeated recipe overall (Fig. 3c,f, Suppl. Fig. 14). For the Sustainable Burger 2, a beef-mushroom blend with an environmental impact sore of 1.02, we perform the same steps, but now select the most repeated recipe that contains both beef and mushroom (Fig. 3d, g, Suppl. Fig. 15).
The nutritious burger
We quantify nutritional quality using established nutritional profiling models that compare food and nutrient composition against dietary guidelines, including the healthy eating index31, nutri-score54, and health star rating55. Here we use the healthy eating index developed by the U.S. Department of Agriculture to assess alignment with the Dietary Guidelines for Americans and emphasizes food-group adequacy rather than individual nutrients56,57. We obtain food-group equivalents from the USDA Food Patterns Equivalents Database58 and nutrient composition data from USDA FoodData Central59, and compute the healthy eating index by aggregating ingredient-level food-group and nutrient contributions, normalized to 500 kcal servings (Suppl. Material S.1.7, Suppl. Figs. 6 and 7). For the Nutritious Burger, a bean-based formulation with a healthy eating index of 63.12, we draw 1 million samples, sort them by their healthy eating index (Fig. 4e), and select the most repeated recipe within the top 5% (Fig. 4d, f, Suppl. Fig. 16).
The personalized burger
We account for inter-individual variation in nutritional requirements using a personalized nutrient profiling model that tailors recipes to age, sex, body composition, and physical activity level60. We compute a personalized nutrition score on a 0-100 scale using individual characteristics, including age, sex, body weight, height, and physical activity level. We derive nutrient-specific target ranges from dietary reference intakes and acceptable macronutrient distribution ranges61,62, together with World Health Organization guidelines on upper intake limits for sodium, free sugars, and saturated fats63,64,65. We aggregate these targets into a single personalized nutrition score for each burger (Suppl. Material S.1.7). Using this framework, we generate personalized burger recipes for two representative demographic profiles, a 15-year-old, 180 cm, 80 kg active male and a 70-year-old, 170 cm, 70 kg moderately active female (Fig. 4g) and additional personalized recipes (Supplementary Fig. 8).
Burger validationBurger preparation
Our AI-generated recipes specify ingredients and quantities only, and do not include the processing or cooking steps needed to prepare the actual burgers. We therefore engage an executive chef to translate each ingredient list into standardized preparation, cooking, and assembly protocols, including ingredient handling, cutting, seasoning, cooking method, and burger assembly (Suppl. Material S.3). We then provide these finalized protocols to an independent group of chefs, who prepare the five AI-generated burgers and obtain the original Big Mac® for comparison in the sensory survey (Suppl. Material S.4).
Sensory survey
We conduct a blind sensory evaluation with n = 101 voluntary participants from the general population at an active restaurant in San Francisco, CA, in accordance with Stanford University Institutional Review Board guidelines (Supplementary Fig. 9). Each participant evaluates all six burgers on a 7-point Likert scale for overall liking, flavor, and texture66, and answers check-all-that-apply questions for 12 flavor- and 15 texture-related attributes (Suppl. Material S.2, Supplementary Data). All survey responses are fully anonymized.
Demographics
Of the n = 101 participants, 47.5% are male, 47.5% female, 3% non-binary, and 2% prefer not to say; 22% are 18–25 years old, 26% are 26–35, 19% are 36–45, 18% are 46–55, and 16% are older than 55; 65% are omnivores and 35% are flexitarians; the highest degree of education of 4% is a high school degree, 24% college, 50% batchelor’s, 11% master’s, 8% Ph.D. or higher, and 3% trade school; 4% eat burgers every day, 20% 2–3 times per week, 31% once a week, 27% 2–3 times per month, 16% every 1–2 months, and 3% 4–5 times per year (Supplementary Fig. 10).
Power and sample size
We select the number of participants, n = 101, to balance feasibility with statistical power. For the Likert-scale ratings, this sample size enables detection of small-to-moderate effect sizes using two-sided Welch’s t-tests. For the binary sensory attributes, the sample size provides > 80% power to detect differences of more than 20% between burgers at a significance level of p < 0.05 using paired comparisons. We did not perform an a priori power calculation; however, the sample size of n = 101 is comparable to or larger than those commonly used in consumer surveys of food products.
Statistical analysis
We report sensory ratings for overall liking, flavor, and texture on a 7-point Likert scale as mean ± standard deviation. We use two-sided Welch’s t-tests to compare the AI-generated burgers against the Big Mac®. We report binary flavor and texture attributes as percentage values and perform paired comparisons to assess statistical significance using two-sided binomial tests. We do not correct for multiple comparisons, as all tests were planned and hypothesis-driven. We report statistical significance as p < 0.05 (Figs. 2f, g, 3f, g, 4f).