

Unsupervised clustering identifies four consensus gene expression-based clusters
Our primary objective was to evaluate whether the existing gene expression endotyping signatures for patients with sepsis identified similar biology. To ensure validity and reproducibility, we applied the same methods in parallel across the public and SUBSPACE cohorts (Extended Data Fig. 1). First, we assigned standardized severity labels to each of the 1,460 blood samples from 19 independent public studies, encompassing adult and pediatric patients infected with 1 of 15 types of bacterial and viral infections21,22,23,24,25,26,27,28,29,30,31,32,33,34,35,36,37,38 (Supplementary Table 1): healthy, mild or moderate infections (those who did not require ICU admission), severe infections (those who required ICU admission) and fatal infections19. Next, we used combat co-normalization using controls (COCONUT) to co-normalize these datasets and ensured that there were no batch effects post-normalization (Supplementary Fig. 1).
We excluded two endotype signatures, Cano-Gamez sepsis response signature (SRS) and Davenport SRS, from the public dataset analysis because several of their genes were not measured in all datasets. For the remaining five endotyping schemas (Fig. 1a), we generated continuous endotype scores for all samples and used hierarchical clustering, principal component analysis (PCA) and network analysis to evaluate the overlap between them. Each method identified similar clusters across endotype schemas (Fig. 1b–d), suggesting that these schemas identified the same endotypes despite using different methodologies and populations. Silhouette index analysis found that the ideal number of clusters varied between two and four, depending on the etiology and severity of infections (Extended Data Fig. 2a–e). For instance, when using all infections, irrespective of severity, the optimal number of clusters was three; however, when using only severe infections, the optimal number of clusters was four. Importantly, across all clustering methods, the same set of endotypes grouped together across four clusters, regardless of the optimal number. Bootstrapping with 1,000 repetitions confirmed this result (P < 0.01; Extended Data Fig. 2f). Therefore, we carried forward these four consensus clusters to further evaluate whether there were important biological and clinical differences. Among these four clusters, two included endotypes that have been previously associated with worse outcomes, which we refer to as detrimental clusters, whereas the other two included endotypes that have been previously associated with improved outcomes, which we refer to as protective clusters. Importantly, this corroborates prior pathway analyses, which have suggested that the biology underlying these endotypes may overlap despite using different endotype-defining genes (Extended Data Table 1). Finally, analysis of pairwise correlation of genes across these four clusters, showing that genes within each cluster were highly correlated, again suggested that these endotype schemas were identifying common biology despite the use of different genes identified using different methods and patient populations (Extended Data Fig. 3).
Fig. 1: Identification of consensus endotypes in public data.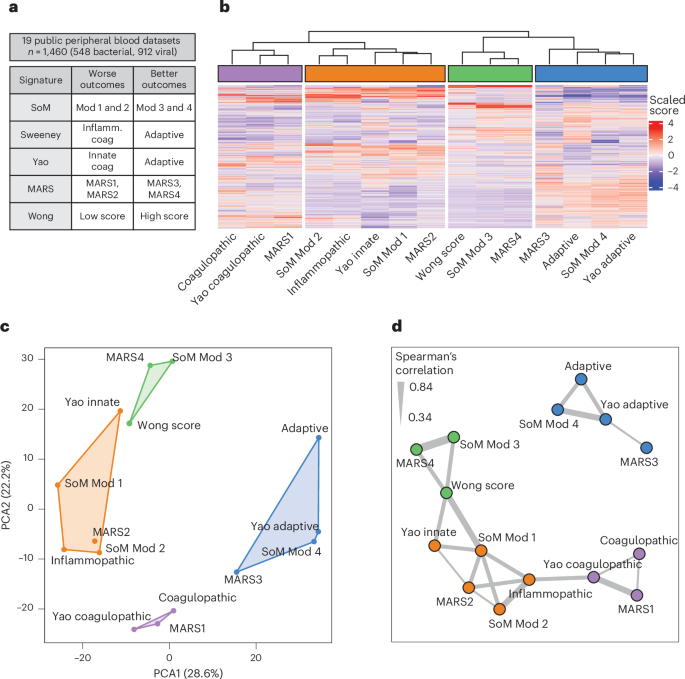
a, Peripheral blood gene expression data from 19 cohorts inclusive of 548 samples from bacterially infected patients and 912 samples from virally infected patients co-normalized. We calculated the five sepsis signatures and scaled values for unsupervised clustering. b, Unsupervised hierarchical clustering performed by scaled gene expression score (x axis) across all samples (y axis) identifying four consensus endotypes. c, The four identified consensus endotypes separated well in PCA. d, Network analysis performed on scaled scores using Spearman’s correlation >0.33 to identify edges. Clusters were identified using a greedy forward algorithm, which identified four clusters mirroring those identified by unsupervised hierarchical clustering. The thickness of the line represents correlation between the nodes it connects. Coag, coagulopathic; Inflamm., inflammopathic; Mod, module.
Next, we investigated whether these 4 molecular endotypes were reproducible using 4,106 blood samples from 3,380 patients across 12 independent prospective cohorts from 10 centers integrated through the SUBSPACE consortium. These samples represented broad heterogeneity, including pediatric and adult patients, noncritical and critically ill patients and infected and noninfected patients, inclusive of both bacterial and viral sepsis (Fig. 2a and Supplementary Table 2). All gene expression data, except the MESSI cohort due to a lack of healthy participants, were COCONUT co-normalized. Housekeeping genes and uniform manifold approximation and projection (UMAP) showed appropriate co-normalization (Supplementary Fig. 2). We calculated continuous endotype scores from each of the seven gene expression signatures for each sample. Once again, unsupervised hierarchical clustering and network analysis identified four gene expression-based clusters, with the addition of quantitative SRS (SRSq) scores clustering with detrimental endotypes (Fig. 2b–e). In the SUBSPACE cohorts, unsupervised clustering identified identical clusters to the public data whereas network analysis identified similar subgroups with the exception of the Sweeney coagulopathic signature and the Wong signature clustering with the detrimental endotypes now containing SRSq, suggesting some similarities between these endotypes. Importantly, none of the clusters was driven by a single cohort (Fig. 2c).
Fig. 2: Identification of consensus endotypes in SUBSPACE data.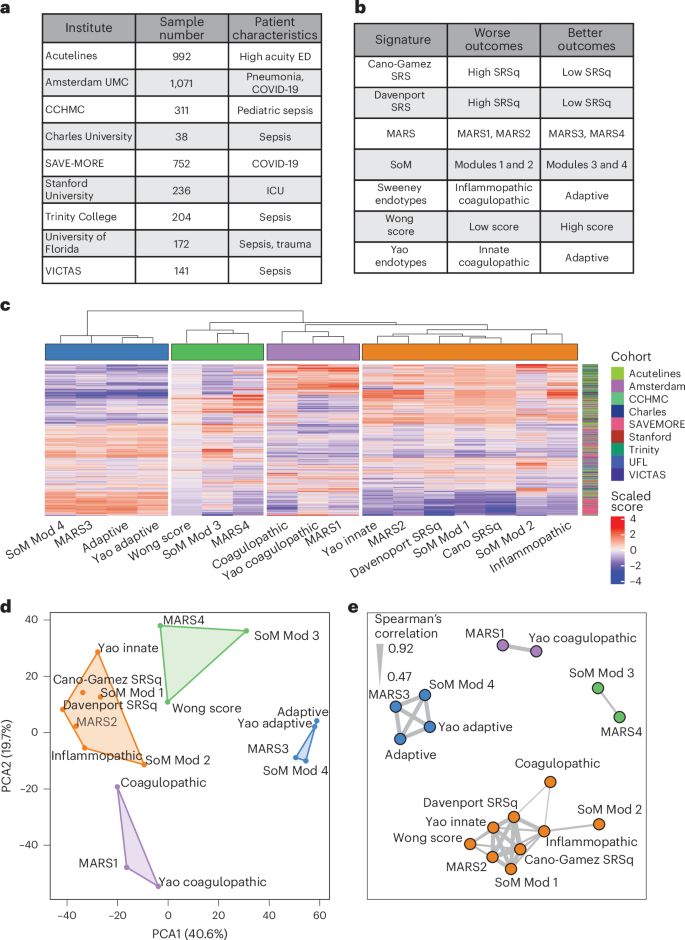
a, Peripheral blood gene expression data collected and co-normalized from 3,917 samples across 11 cohorts from 9 international centers. UMC, University Medical Center; CCHMC, Cincinnati Children’s Hospital Medical Center. b, Application of seven prior sepsis endotyping signatures and scaled signature scores for unsupervised clustering. c, Unsupervised hierarchical clustering performed by scaled gene expression score (x axis) across all samples (y axis) identifying four consensus endotypes. Samples did not cluster together by cohort. d, The four identified consensus endotypes separating well on PCA. e, Network analysis performed on scaled scores using Spearman’s correlation >0.47 (median correlation) to identify edges. The clusters were identified using a greedy forward algorithm, which identified four clusters. The thickness of the line represents correlation between the nodes it connects.
Collectively, our results demonstrated that, despite the biological, clinical and technical heterogeneity across cohorts, the endotypes identified by different schemas converge to four consensus molecular clusters, henceforth called consensus endotypes. These molecular subgroups separated based on detrimental and protective endotypes. Overall, this suggests that prior sepsis transcriptomic signatures share a biological basis that may be leveraged to better understand sepsis pathogenesis and treatment.
Four consensus endotypes can be explained along the myeloid and lymphoid axes
After identifying the consensus of these discrete endotyping signatures, we next evaluated the immunological underpinnings of these consensus endotypes and developed a more generalizable immune framework. We evaluated the 7 endotyping signatures using single-cell RNA sequencing (scRNA-seq) data by integrating 602,388 immune cells from 258 samples from 4 publicly available COVID-19 and sepsis scRNA-seq datasets that included neutrophil profiles39,40,41,42 (Supplementary Table 3). We identified 14 unique cell types (Fig. 3a and Methods) and found that cell type and severity explained the largest variability (Supplementary Fig. 3a,b). The consensus endotypes separated along cellular origin and detrimental or protective effects, which we defined based on whether the corresponding endotype was associated with worse or improved prognosis (that is, higher severity or mortality) in prior studies. Consensus endotypes included a detrimental myeloid cluster (Sweeney inflammopathic, Yao innate, SoM modules 1 and 2, and MARS2), a protective myeloid cluster (Wong score, MARS4 and SoM module 4), a protective lymphoid cluster (Sweeney adaptive, Yao adaptive, SoM module 4 and MARS3) and a mixed myeloid or lymphoid cluster (Sweeney coagulopathic, Yao coagulopathic and MARS1) (Fig. 3b).
Fig. 3: Single-cell analysis of consensus endotypes.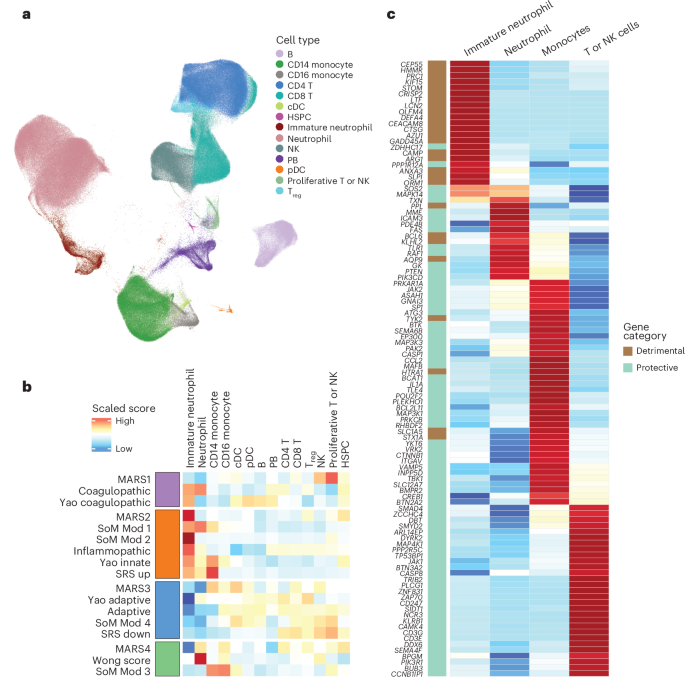
a, Integration of 4 whole-blood scRNA-seq datasets from patients with COVID-19 and sepsis, inclusive of the neutrophil compartment and identifying 14 unique cell types using the Seurat and Scanpy pathways. The UMAP of cell types is shown. b, Evaluation of scaled gene expression signatures across these cell types, showing that the scores included in each consensus molecular endotype were expressed in similar cell types. The red cluster (MARS2, SoM module 1 or 2, Sweeney inflammopathic, Yao innate and SRS signatures) was predominantly expressed with immature neutrophils. The blue cluster (MARS3, Yao adaptive, Sweeney adaptive and SoM module 4) was predominantly expressed in T or NK cells. The purple cluster (MARS1, Sweeney coagulopathic and Yao coagulopathic) was a mix of intermediate expression of neutrophils and T or NK cells. The green cluster (MARS4, Wong score and SoM module 3) was predominantly expressed in mature neutrophils and monocytes. c, Development of a cell-type-specific score by evaluating scaled expression of each gene across all endotype signatures and selecting 104 genes that were selectively expressed (defined by >1 s.d. greater than other cell types evaluated) in myeloid or T or NK cell types. We then divided these genes into detrimental or protective genes based on whether the signature from which they were derived was associated with worse or better outcomes in prior studies. cDC, classical dendritic cell; HSPC, hematopoietic stem and progenitor cell; PB, peripheral blood; pDC, plasmacytoid dendritic cell.
Although predominant cell-type expression explained these consensus endotypes to some extent, genes in these signatures were expressed across multiple cell types (Fig. 3b and Supplementary Fig. 4). To isolate myeloid-specific and lymphoid-specific dysregulation scores, we evaluated the cell specificity of all genes used in the 7 signatures and identified 104 genes that were selectively expressed in either myeloid or lymphoid cells. We divided these genes into myeloid detrimental, myeloid protective and lymphoid protective subgroups based on whether the original endotyping signature in which they were included was considered detrimental or protective as previously defined (Fig. 3c and Supplementary Table 4). Importantly, no lymphoid-specific genes were found in any of the detrimental signatures evaluated. We then defined myeloid and lymphoid dysregulation scores as the difference between the geometric mean of detrimental genes (when applicable) and the geometric mean of protective genes, for a given cell lineage. Evaluation of myeloid and lymphoid dysregulation scores using scRNA-seq data confirmed their cell-type specificity (Supplementary Fig. 5a–d). Myeloid and lymphoid dysregulation scores were moderately correlated with each other (r = 0.49, P < 2.2 × 10⁻¹⁶; Supplementary Fig. 6) in bulk transcriptome data from the SUBSPACE cohorts.
Overall, scRNA-seq data demonstrated that the four consensus endotypes were associated with distinct expression profiles in myeloid and lymphoid immune cells.
Cell-lineage-specific quantification generates a clinically relevant immune dysregulation framework
Association of consensus molecular endotypes with distinct immune cell types presented an opportunity to define an immune response-based evaluation framework, which we term the human immune dysregulation evaluation framework (Hi-DEF). We hypothesized that use of these gene expression-based scores to quantify myeloid- and lymphoid-specific dysregulation for each patient would reduce between-patient heterogeneity.
To test this hypothesis, we computed the lymphoid and myeloid dysregulation scores as defined above for each sample in the public datasets. Both myeloid and lymphoid dysregulation scores increased significantly with severity across public datasets (Jonckheere–Terpstra (JT) t-test P < 2.2 × 10⁻¹⁶ for both scores; Fig. 4a). Next, we defined an abnormal lymphoid or myeloid dysregulation score using the 95th percentile of each score in healthy participants, which corresponds to a z-score of 1.65, and defined four quadrants: balanced, lymphoid dysregulation, myeloid dysregulation and system-wide dysregulation (Fig. 4b). Patients with either a myeloid or a lymphoid dysregulation score ≥1.65 had a significantly higher risk of severe infection or mortality (odds ratio (OR) = 5.2, 95% confidence interval (CI) 3.9–7.0, P < 2.2 × 10⁻¹⁶) compared with those with both scores <1.65 (Fig. 4c,d). The risk of severe infection or mortality was highest for patients with system-wide dysregulation, with 51% of these patients experiencing severe infections compared with 24% in the myeloid dysregulation subgroup, 10% in the lymphoid dysregulation subgroup and only 6% in the balanced subgroup (P < 0.01 across all comparisons; Fig. 4d). These results remained significant across multiple sensitivity analyses, including adult and pediatric cohorts (Supplementary Fig. 7), bacterial and viral infectious etiologies (Supplementary Fig. 8) and US versus non-US cohorts (Supplementary Fig. 9).
Fig. 4: Evaluation of the immune dysregulation framework in public and SUBSPACE data.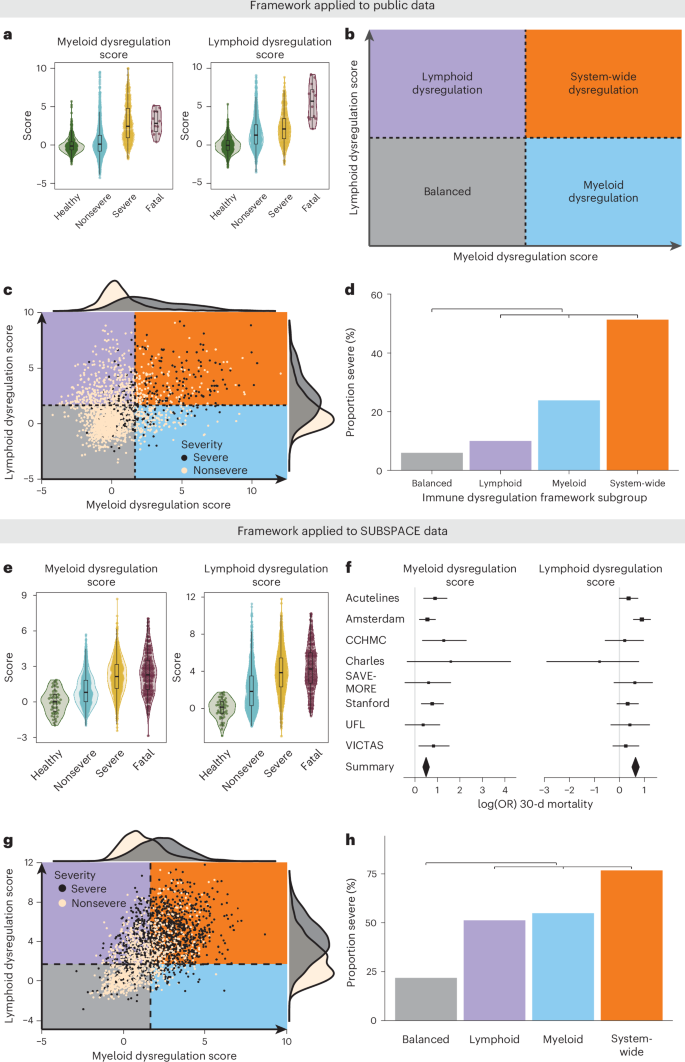
a, Myeloid (left) and lymphoid (right) scores (calculated as z-scores relative to healthy participants) calculated for all public samples (n = 2,096). The box plots represent the median and interquartile range (IQR) whereas whiskers represent the range of data excluding outliers (1.5× the IQR). The association of increasing scores (y axis) with increasing severity (x axis) was calculated using the JT t-test. Myeloid and lymphoid dysregulation scores were associated with severity (P < 2.2 × 10⁻¹⁶ for both scores). b, Theoretical framework for defining immune dysregulation with myeloid dysregulation on one axis and lymphoid dysregulation on the other. This provides a means of subgrouping patients into four subgroups depending on the level of dysregulation present: (1) balanced: both dysregulation scores low; (2) lymphoid dysregulation: only lymphoid dysregulation score elevated; (3) myeloid dysregulation: only myeloid dysregulation score elevated; and (4) system-wide dysregulation: both myeloid and lymphoid dysregulation scores elevated. c, The immune dysregulation framework applied to public co-normalized data (n = 2,096). Cut-offs are defined by a z-score of 1.65 relative to healthy participants. The black dots represent patients with severe infections (defined by ICU admission), whereas the tan dots represent nonsevere infections. d, Barplot representing the proportion of severe infections (y axis) by immune dysregulation framework subgroup (x axis). The OR was calculated using two-sided Fisher’s exact test unadjusted for multiple comparisons, comparing patients with dysregulation on any axis relative to the balanced subgroup. Dysregulation on either the myeloid or the lymphoid axis (inclusive of lymphoid dysregulation (n = 449), myeloid dysregulation (n = 197) and system-wide dysregulation (n = 259) subgroups) was associated with severe infections with an OR of 5.2 (95% CI 3.9–7.0, P < 2.2 × 10⁻¹⁶) compared with patients in the balanced subgroup (n = 1,191). e, Myeloid (left) and lymphoid (right) scores (calculated as z-scores relative to healthy participants) were calculated for baseline SUBSPACE samples with phenotype data available (n = 2,212). The box plots represent the median and IQR whereas the whiskers represent the range of data excluding outliers (1.5× the IQR). The association of increasing scores (y axis) with severity (x axis) was calculated using the JT t-test. Myeloid dysregulation and lymphoid dysregulation scores were associated with severity (P < 2.2 × 10⁻¹⁶ for both scores). f, Forest plots showing log(OR) and 95% CIs of 30-d mortality across each site, calculated using logistic regression and showing strong association with mortality: myeloid dysregulation score (left) and lymphoid dysregulation score (right). Patient numbers by site were: ACUTELINES (n = 275), Amsterdam (n = 717), Cincinnati Children’s Hospital Medical Center (n = 184), Charles University (n = 12), SAVE-MORE (n = 452), Stanford University (n = 236), University of Florida (n = 172) and VICTAS (n = 137). g, The immune dysregulation framework applied to SUBSPACE co-normalized data (n = 2,212). Cut-offs were defined by a z-score of 1.65 relative to healthy patients. The black dots represent critically ill patients, whereas the tan dots represent noncritically ill patients. h, Barplot representing the proportion of severe infections (y axis) by immune dysregulation framework subgroup (x axis). The OR was calculated using two-sided Fisher’s exact test unadjusted for multiple comparisons, comparing patients with dysregulation on any axis relative to the balanced subgroup. Dysregulation on either the myeloid or the lymphoid axis (inclusive of lymphoid dysregulation (n = 615), myeloid dysregulation (n = 133) and system-wide dysregulation (n = 1,050) subgroups) was associated with severe infections with an OR of 7.1 (95% CI 5.6–8.9, P < 2.2 × 10⁻¹⁶) compared with patients in the balanced subgroup (n = 564).
Similar to the public datasets, both dysregulation scores increased with severity in the co-normalized SUBSPACE cohorts (JT t-test P < 2.2 × 10⁻¹⁶ for both scores; Fig. 4e). Both the myeloid and the lymphoid dysregulation scores were associated with 30-d mortality across all cohorts with an OR of 1.9 (95% CI 1.3–2.0, P < 0.001) and 1.6 (95% CI 1.6–2.8, P < 0.001), respectively (Fig. 4f). Myeloid dysregulation was most significantly (P < 0.05) associated with mortality in predominantly ICU and bacterially infected cohorts (Stanford and VICTAS), whereas the lymphoid dysregulation score had a more significant (P < 0.05) association with mortality in cohorts with predominantly viral infections (Amsterdam PANAMO and SAVE-MORE), a trend that was further highlighted when we evaluated differences in outcomes solely in virally or bacterially infected patients (Extended Data Fig. 4).
Using a z-score of 1.65 relative to healthy partcipants as a dysregulation threshold, both dysregulation scores ≥1.65 were significantly associated with severe illness requiring ICU level of care or dying within 30 d (OR = 7.1, 95% CI 5.6–8.9, P < 2.2 × 10⁻¹⁶; Fig. 4g,h) in the SUBSPACE cohorts. When considering only 30-d mortality, it was significantly higher in those with either myeloid or lymphoid dysregulation (OR = 3.5, 95% CI 2.3–5.4, P = 5.3 × 10⁻¹²; Extended Data Fig. 5), where the system-wide dysregulation subgroup had the highest mortality rate (18%). Importantly, Hi-DEF also validated in the MESSI cohort, although it was not co-normalized with the SUBSPACE cohorts (Supplementary Fig. 10).
We evaluated whether Hi-DEF was differentiable clinically. Although there were differences in age and white blood counts across subgroups (Supplementary Table 5), there was substantial overlap. In the Stanford cohort, dysregulation was associated with vital and laboratory derangements (Supplementary Table 6); however, overlap would again limit clinical detection. Although the myeloid and lymphoid scores were correlated with the neutrophil-to-lymphocyte ratio (Supplementary Fig. 11), both myeloid (OR = 2.1, 95% CI 1.7–2.7, P < 0.001) and lymphoid (OR = 2.8, 95% CI 2.3–3.5, P < 0.001) scores remained associated with severity and mortality after adjusting for the neutrophil-to-lymphocyte ratio.
Hi-DEF demonstrates the need for flexible context-dependent subgrouping
A key limitation of existing transcriptomic sub-phenotyping schemas is that they often ‘force’ subgroupings and thus lack generalizability beyond the populations in which they were developed. For instance, an ‘appropriate’ immune response to an upper respiratory tract infection or viral pneumonia may be inadequate for Gram-negative bacteremia; however, current endotyping schemas do not allow this nuanced evaluation.
To illustrate this issue, we analyzed differences in myeloid and lymphoid dysregulation by severity (Fig. 5a), recruitment location (Supplementary Fig. 12) and infectious etiology (Extended Data Fig. 6a). These analyses confirmed substantial differences in the magnitude and range of immune dysregulation. For example, patients enrolled in emergency department or non-ICU settings had lower dysregulation scores than those enrolled in an ICU (Supplementary Fig. 12). Next, analysis of the proportion of healthy participants, and those with mild, severe or fatal illness across myeloid and lymphoid score quintiles, found that the composition of patients varied substantially across these quintiles (Fig. 5b,c). These results show that differences in cohort composition (that is, a mix of critically and noncritically ill individuals versus solely critically ill patients) affect the dysregulation measured and subsequent results of endotyping schemas, which is in line with the analysis that showed differences in ‘ideal’ cluster number by severity and infectious etiology (Extended Data Fig. 2). Importantly, we found that the thresholds for optimal sensitivity and specificity varied depending on whether the goal was to differentiate mild disease from healthy participants compared with differentiating severe or fatal disease from mild cases (Fig. 5d,e). In addition, these thresholds varied depending on whether a patient had a viral or a bacterial infection (Extended Data Fig. 6b,c). Together, these results further suggest that the differing number of endotypes identified by prior unsupervised approaches, even though they identified similar biology, may stem from the differences in cohort composition. Overall, these results also demonstrate the need for a flexible, generalizable framework to better evaluate immune dysregulation across these diverse clinical contexts.
Fig. 5: Ideal threshold for immune subgrouping identification depends on clinical cohort and question.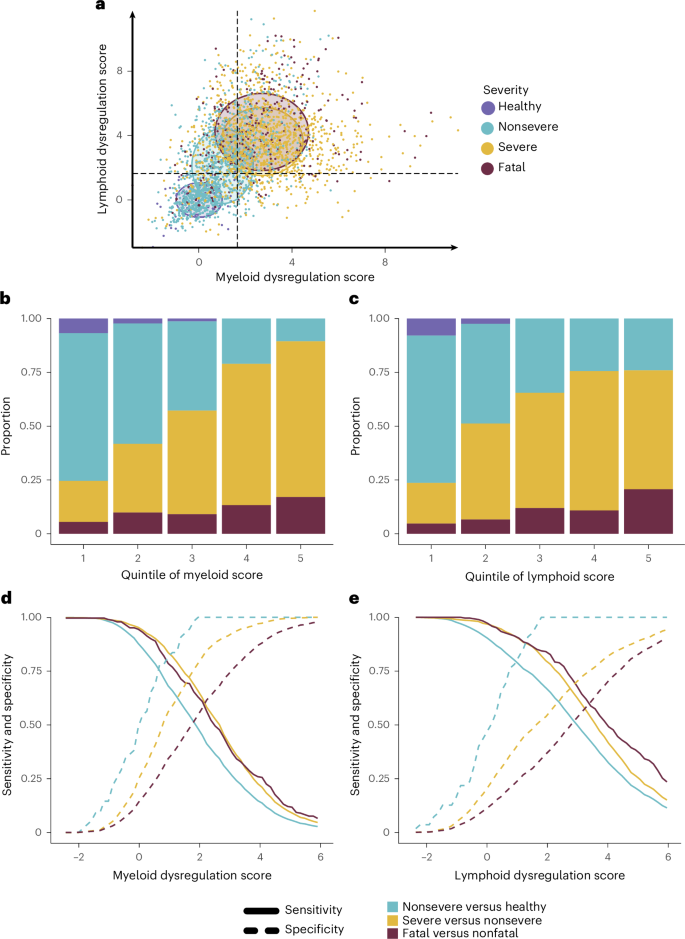
a, Mean and s.d. of the myeloid (x axis) and lymphoid (y axis) dysregulation scores represented graphically, stratified by severity (defined by critical versus noncritical illness). The individual dots represent patient samples colored by severity and circles the mean and s.d. of lymphoid dysregulation scores. Together this shows the differences that patient cohort composition may have on endotype-defining gene expression signatures. b, Evaluation of the proportion of severity subgroups within the quintiles of myeloid dysregulation scores, indicating how different thresholds would affect the patient population above each threshold. c, Evaluation of the proportion of severity subgroups within the quintiles of lymphoid dysregulation scores, indicating how different thresholds would affect the patient population above each threshold. d, Evaluation of the sensitivity (solid line) and specificity (dashed line) of different myeloid dysregulation score thresholds when identifying mild or moderate infections from healthy participants (blue), severe from mild or moderate infections (yellow) and fatal from nonfatal (red) cases. These results show that the ideal dysregulation threshold will depend on the clinical question. e, Evaluation of the sensitivity (solid line) and specificity (dashed line) of different lymphoid dysregulation score thresholds when identifying mild or moderate infections from healthy participants (blue), severe from mild or moderate infections (yellow) and fatal from nonfatal (red) cases. These results show that the ideal dysregulation threshold will depend on the clinical question.
Hi-DEF generalizes to other critical illness syndromes
Prior studies have highlighted the similar pathobiology underlying systemic inflammation in sepsis, burns and trauma3. We evaluated whether Hi-DEF could offer insights into other critical illness syndromes. We first examined the Glue Grant cohort43, which included 430 noninfected, critically ill patients with trauma or burns. We integrated gene expression data from the Glue cohort with SUBSPACE data using COCONUT co-normalization and defined dysregulation as myeloid or lymphoid scores greater than or equal to the median scores across all SUBSPACE patients who required ICU level of care. Higher myeloid or lymphoid dysregulation scores were significantly associated with severe outcomes, defined as multi-system organ failure or mortality (OR = 2.0, 95% CI 1.1–3.7, P = 0.02; Extended Data Fig. 7a,b). This association was predominantly driven by myeloid dysregulation and remained significant after adjusting for sex and Acute Physiology and Chronic Health Evaluation II (APACHE II) score (adjusted myeloid dysregulation score: OR = 1.3, 95% CI 1.0–1.8, P = 0.045), whereas lymphoid dysregulation was not associated with multi-system organ failure or mortality.
Next, we evaluated whether Hi-DEF was associated with ARDS in the Stanford cohort using the same cut-off as the Glue Grant cohort. Higher myeloid or lymphoid dysregulation scores were significantly associated with the presence of ARDS (OR = 2.7, 95% CI 1.3–6.0, P = 0.005; Extended Data Fig. 7c,d). After adjusting for sex and APACHE II score, the lymphoid dysregulation score was significantly associated with ARDS (adjusted OR = 1.2, 95% CI 1.02–1.37, P = 0.03), but the myeloid dysregulation score was not. Together, these results suggest that Hi-DEF may provide insights into similarities and differences across diverse critical illness syndromes.
Hi-DEF generalizes to immunocompromised patients
To investigate the generalizability of Hi-DEF in immunosuppressed patients, we evaluated two cohorts (Stanford ICU and MESSI) that recruited from quaternary care center ICUs with substantial immunosuppressed populations. In the Stanford and MESSI cohorts, 28% and 46% of patients, respectively, were immunocompromised. Myeloid and lymphoid dysregulation scores were significantly higher in immunocompromised patients in the Stanford cohort (Wilcoxon’s P = 0.002, P = 0.02, respectively) but were not different in the MESSI cohort. In the Stanford cohort, immunocompromised patients were more likely to be dysregulated (OR = 2.8, 95% CI 1.3–6.7, P = 0.006), but not in the MESSI cohort (Extended Data Fig. 8a–d). In both cohorts, although immunocompromised status was associated with worse outcomes, this did not differ significantly by assigned subgroup (Extended Data Fig. 8e,f). In both cohorts, the myeloid dysregulation score remained significantly associated with 30-d mortality after adjustment for immune status (P = 0.004 and P < 0.001, respectively). Overall, these results suggest that Hi-DEF is not significantly affected by baseline immunocompromise as defined in these cohorts and can be used to further substratify this high-risk population.
Hi-DEF is associated with differential response to immune-modulating medications across critical illnesses
Numerous clinical trials of immune-modulating agents in critical illness have been negative, which is often attributed to underlying biological heterogeneity causing differential treatment response4. We hypothesized that our proposed Hi-DEF would reduce the biological heterogeneity and be associated with a differential treatment response.
To test this hypothesis, we first used the SAVE-MORE cohort, a randomized controlled trial of anakinra in noncritically ill, hospitalized patients with COVID-19 and elevated soluble urokinase plasminogen-activating receptor, which showed a mortality benefit of anakinra in the entire cohort44. In this study, dysregulation was defined by a z-score greater than or equal to the median dysregulation score in noncritically ill, infected patients across all SUBSPACE cohorts. Patients with lymphoid dysregulation at baseline treated with anakinra had a significantly lower rate of 28-d mortality (2.2%) compared with those treated with placebo (20.8%, Fisher’s P = 0.02, P (interaction) = 0.05; Fig. 6a). There was no difference in 28-d mortality rate in patients without baseline lymphoid dysregulation (P = 0.77). It is interesting that the subgroup of patients with lymphoid dysregulation experienced the highest mortality benefit from anakinra, but those with only myeloid dysregulation did not (Supplementary Fig. 13a,b). This survival benefit in patients with lymphoid dysregulation remained significant even after adjustment for age, sex and baseline sequential organ failure assessment (SOFA) score (adjusted hazard ratio (HR) = 0.06, 95% CI 0.008–0.53, P = 0.01; Fig. 6b). Together these results suggest that anakinra preferentially benefits patients with baseline lymphoid dysregulation.
Fig. 6: Association of lymphoid immune dysregulation with treatment.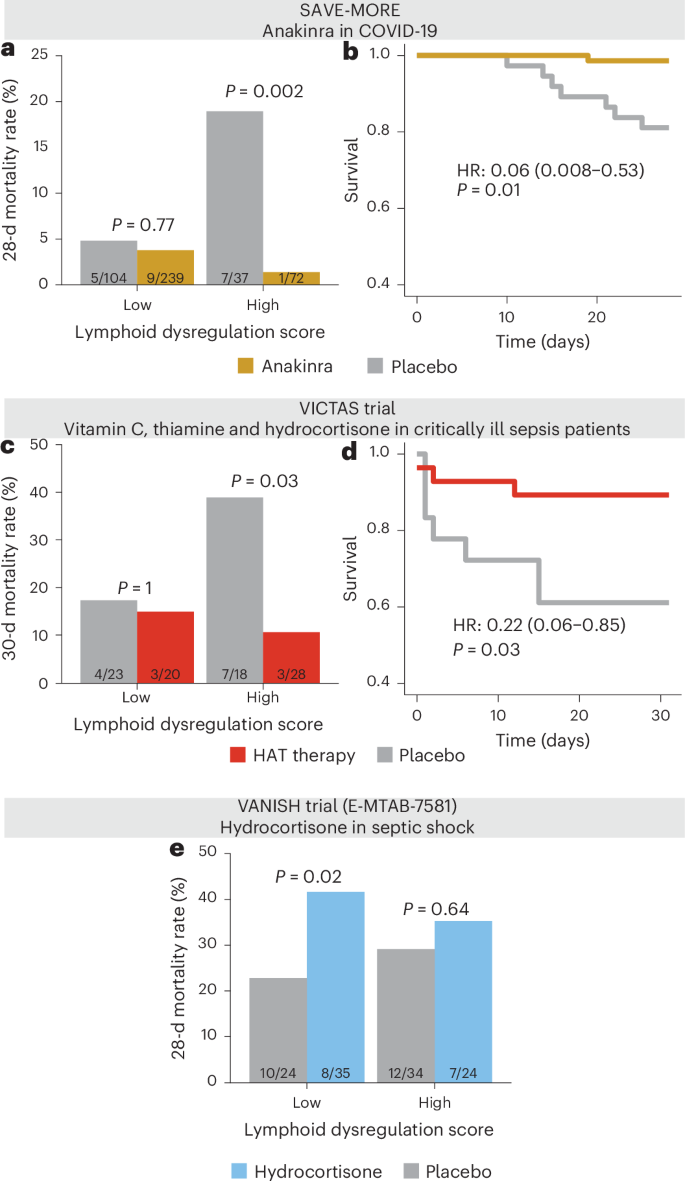
a, Evaluation of 28-d mortality rate on the y axis stratified by high and low lymphoid dysregulation scores (defined by z-score ≥ 1.65) and anakinra (gold) versus placebo (gray) treatment in patients with COVID-19 in the SAVE-MORE clinical trial, using two-sided Fisher’s exact test unadjusted for multiple comparisons. Dysregulation was defined based on median scores across all noncritically ill, infected patients in SUBSPACE. Lymphoid dysregulation is associated with a disproportionate benefit from anakinra therapy relative to patients with low (balanced) lymphoid responses. b, Evaluation of Kaplan–Meier survival curve for 28-d survival in patients with lymphoid dysregulation stratified by anakinra (gold) and placebo (gray) in the SAVE-MORE trial. Cox’s proportional HR is adjusted for age, sex and SOFA score. c, Evaluation of 30-d mortality (y axis) in the VICTAS trial (a randomized controlled trial of vitamin C, thiamine and hydrocortisone in critically ill patients with sepsis) stratified by high and low lymphoid dysregulation score and treatment (red) versus placebo (gray). Dysregulation was defined by the median score across all infected, critically ill patients in SUBSPACE, and the significance was assessed using two-sided Fisher’s exact test unadjusted for multiple comparisons. The results indicate that lymphoid dysregulation was associated with disproportionate benefit from steroids, vitamin C and thiamine therapy. d, Evaluation of Kaplan–Meier survival curve for 30-d survival in patients with lymphoid dysregulation stratified by treatment (red) versus placebo (gray) in the VICTAS trial. Cox’s proportional HR is adjusted for age and sex. e, Evaluation of the 28-d mortality rate (y axis) in the VANISH trial (a clinical trial of hydrocortisone in patients with septic shock) stratified by high and low lymphoid dysregulation score (defined by median score) and randomized steroid treatment (red). The significance was assessed using two-sided Fisher’s exact test unadjusted for multiple comparisons. Patients with a low (balanced) lymphoid dysregulation score were disproportionately harmed by steroid therapy.
Next, we evaluated whether Hi-DEF was associated with a differential response to corticosteroids using two independent studies. The VICTAS trial was a randomized controlled trial of hydrocortisone, vitamin C and thiamine in 501 patients with sepsis45. A subset of patients (n = 141) had blood transcriptome data available. We excluded the 52 (37%) patients who received open-label steroids (and were thus randomized only to receipt of thiamine and vitamin C versus placebo). Patients were divided into subgroups based on whether dysregulation scores were greater than or equal to median scores across all infected, critically ill patients in the SUBSPACE consortium. In this limited cohort of patients with available RNA-seq data, there was a trend toward mortality benefit (26% mortality rate in placebo versus 11% with the three-drug active treatment; Fisher’s P = 0.11). Again, this apparent benefit was driven by the patients with lymphoid dysregulation at baseline. In patients with high lymphoid dysregulation scores, those treated with hydrocortisone had significantly lower mortality rates compared with those in the placebo arm (11% versus 39%, OR = 0.20, 95% CI 0.03–1.06, Fisher’s P = 0.03; Fig. 6c). This survival difference was robust after adjustment for age and sex (adjusted HR = 0.22, 95% CI 0.06–0.85, P = 0.03; Fig. 6d). The differences were not observed in patients with myeloid dysregulation (Supplementary Fig. 13c,d).
We also evaluated whether lymphoid dysregulation was associated with a differential response to corticosteroids in the VANISH cohort, a randomized controlled, factorial trial that evaluated norepinephrine versus vasopressin and hydrocortisone versus placebo in patients with septic shock46, with no difference in mortality rate related to hydrocortisone administration in the overall trial of 409 patients. In the subset of 176 patients with RNA expression data, hydrocortisone treatment was associated with a 38% mortality rate in those treated with hydrocortisone, compared with 22% in those not treated with hydrocortisone (P = 0.03). Unlike the SAVE-MORE and VICTAS trials, where the benefit of treatment was limited to subgroups with lymphoid dysregulation, this difference in the VANISH cohort was driven largely by increased mortality in patients with low (balanced) lymphoid dysregulation scores treated with hydrocortisone relative to those who did not receive steroids (28-d mortality rate 42% versus 16%, OR = 3.8, 95% CI 1.2–12.6, P = 0.02; Fig. 6e). This difference was not seen based on myeloid dysregulation (Supplementary Fig. 13e,f).
Collectively, these results demonstrated that Hi-DEF provides flexibility for context-specific evaluation and has the potential to identify appropriate immunomodulatory treatment for patients with critical illness, reducing the heterogeneity of treatment effects.


